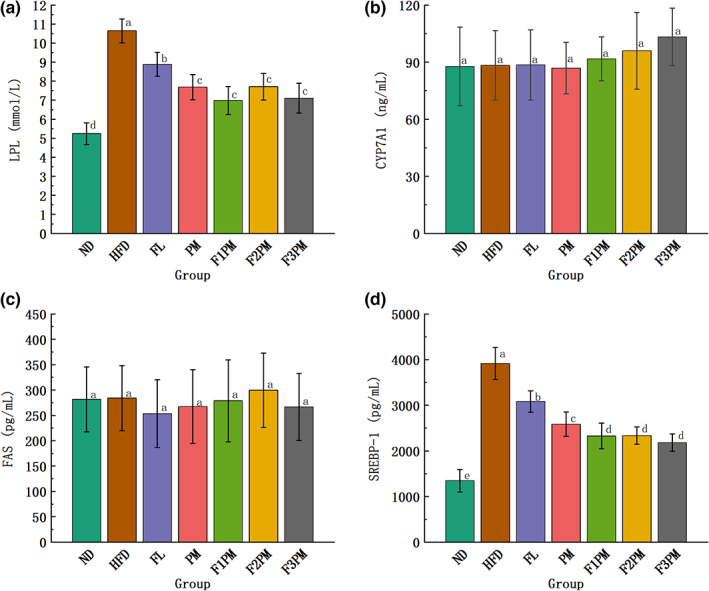
FIGURE 9.

Results of glycolipid metabolism‐related indicators in liver tissue. (a) LPL (lipoprotein lipase); (b) CYP7A1 (cholesterol7α‐hydroxylase); (c) FAS (fatty acid synthase); (d) SREBP‐1 (Sterol regulatory element‐binding transcription factor‐1); Data are means ± SD (n = 12); Groups that do not share the same letter are significantly (p < .05) different from each other.
