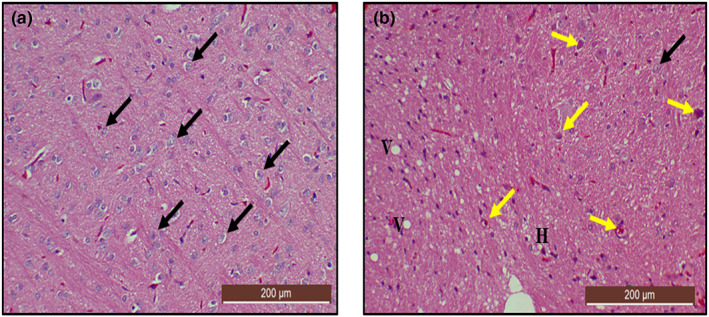
FIGURE 12.

Hematoxylin and eosin (H&E)‐stained cerebral cortex sections from rats treated with (a) normal saline (control); showing the normal architectural and cellular morphology (black arrow) of the cerebral cortex (b) 50 mg/kg of lead (LTG) showing marked degenerations: hyperchromatic cells (yellow arrow), cellular atrophy, pyknosis, and vacuolated cells (V). (H&E, ×10 scale bar = 200 μm)
