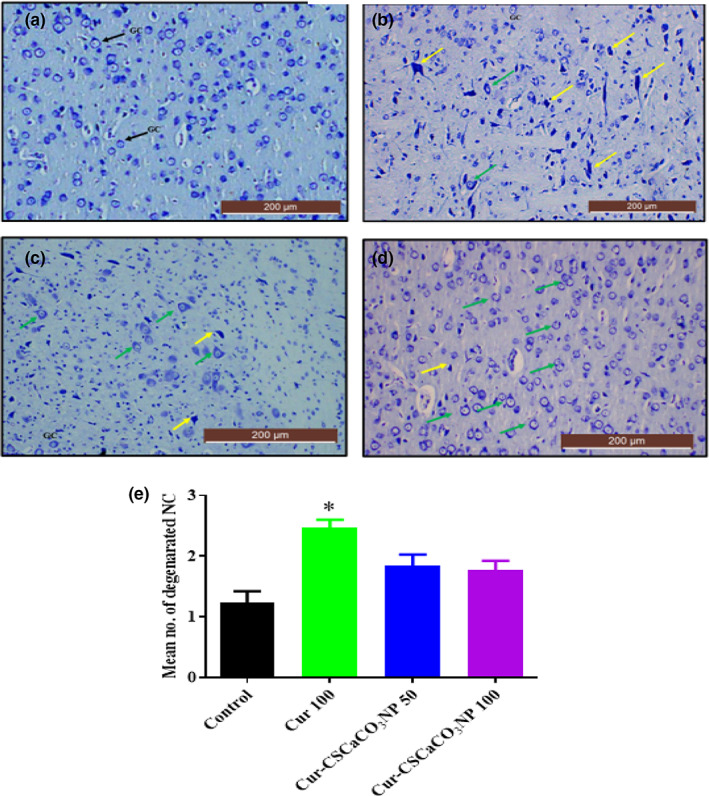
FIGURE 15.

Toluidine blue‐stained cerebral cortex sections from rats treated with (a) normal saline (control); show the array of well‐organized and normal morphology of neuronal cells, granular cells (GC), and pyramidal cells (PMC). (b) 100 mg/kg of curcumin (cur 100) showing cellular degenerations: (c) cur‐CSCaCO3NP 50 and (d) cur‐CSCaCO3NP 100 showing fewer damaged neuronal cells with marked improved normal neuronal cells (green arrow). (e) Quantitative representation of degenerated neuronal cells of the control and all the treated groups. *p < 0.05 versus control, n = 5. (Toluidine blue, ×10, scale bar = 200 μm)
