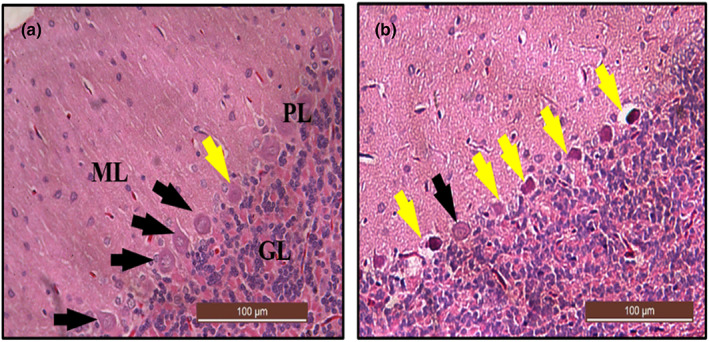
FIGURE 16.

Photomicrograph of cerebellar sections from rats treated with (a) normal saline (control) showing normal histoarchitecture of the cerebrum with abundant healthy viable Purkinje cells (black arrow) and normal molecular layer (ML), Purkinje cells layer (PL), and granular layer (GL). (b) 50 mg/kg of lead (LTG) showing marked degeneration of Purkinje cells (yellow arrow). (H&E, ×20, scale bar = 100 μm).
