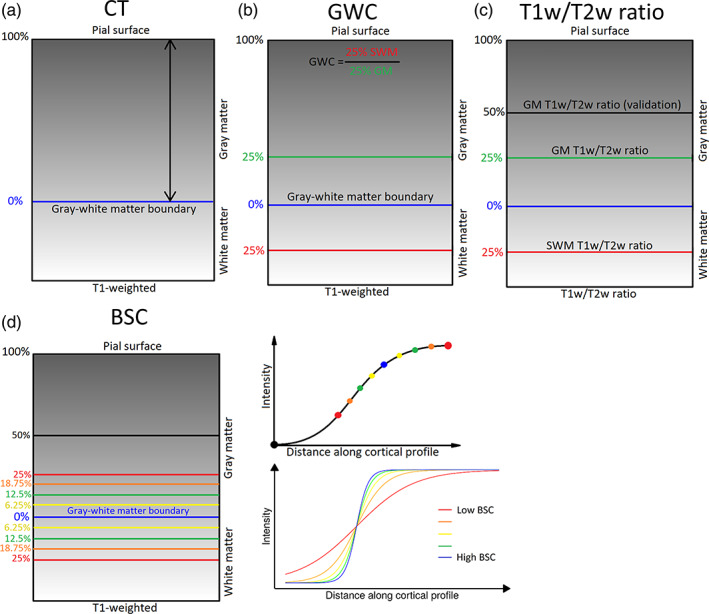
FIGURE 1.

Methods for generating markers. (a) Cortical Thickness (CT) estimates were calculated as the Laplacian distance between the pial surface and the gray–white matter boundary surface at each vertex on the T1‐weighted volume in native space. (b) Gray‐white matter contrast (GWC) was calculated by dividing the intensity at 25% of CT translated into superficial white matter (SWM) by the intensity at 25% of CT into gray matter (GM) at each vertex on the T1‐weighted volume in MNI space. (c) The T1w/T2w ratio measures were generated by sampling the T1w/T2w ratio volume in native space at various distances. GM T1w/T2w ratio was sampled at 25% of CT. SWM T1w/T2w ratio was sampled at 25% of CT translated into SWM. Additionally, a second GM T1w/T2w ratio measure was sampled at 50% of CT in GM (referred to as GM T1w/T2w ratio at 50% of CT). (d) The boundary sharpness coefficient (BSC) was calculated by first sampling 10 T1‐weighted intensities in MNI space around the gray‐white matter boundary (between 50% of CT in GM and 25% of CT in SWM), then fitting a sigmoid curve to the resulting intensity profile at each vertex. The BSC represents the growth parameter of the sigmoid curve, with a higher BSC indicating a sharper gray–white matter transition and a lower BSC representing a more gradual transition.
