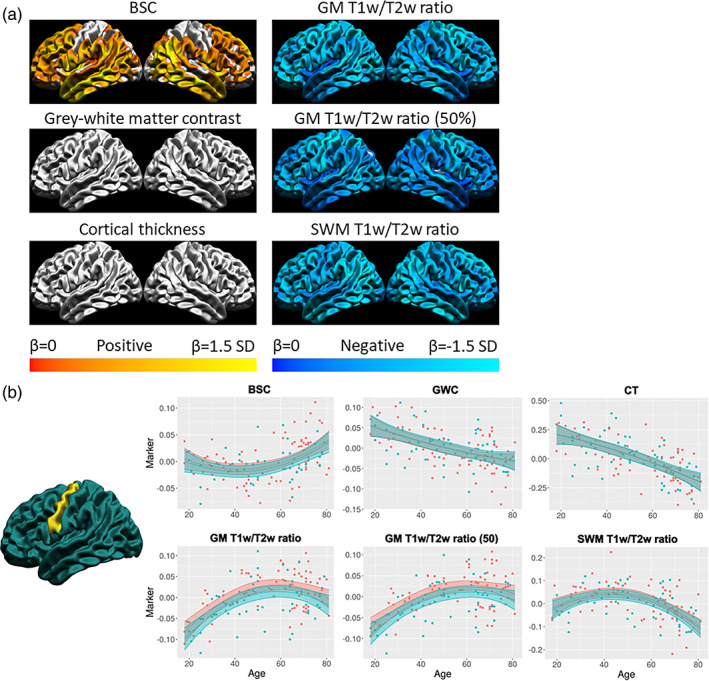
FIGURE 9.

Quadratic age trajectories. (a) For each marker, the mean and standard deviation of the age betas were calculated and used to threshold the colors. Cortical maps are thresholded for significance at the FDR 0.05 level. Cold colors indicate negative age betas and warm colors indicate positive age betas. Light colors indicate higher age betas relative to the marker mean, and dark colors indicate lower age betas. (b) Example of the age trajectory of each marker at one vertex in the precentral gyrus. Blue observations represent male participants and red observations represent female participants. The x‐axis is age and the y‐axis is the marker value residualized for mean curvature.
