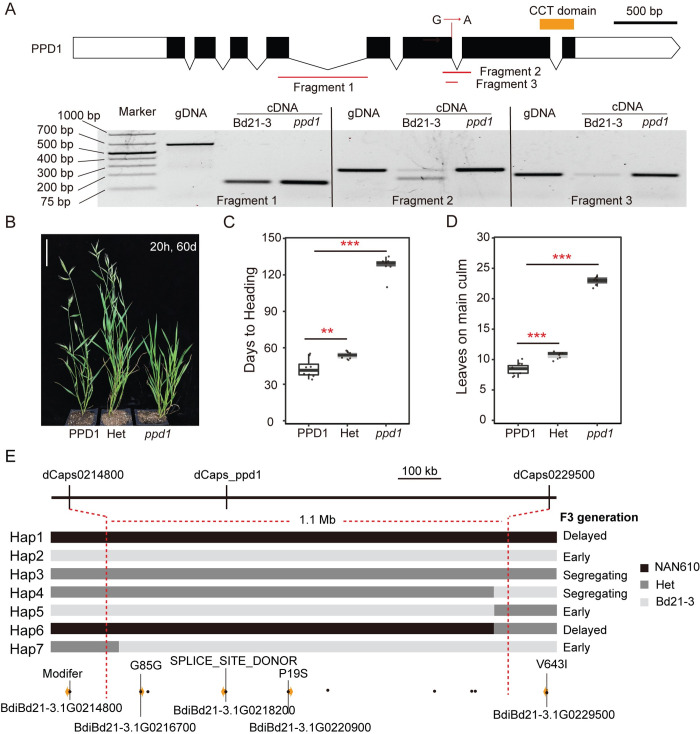
Fig 3. Identification of a ppd1 mutant.
(A) Gene structure of PPD1 showing the location of the nucleotide change of the sodium azide-induced mutation; orange bar indicates the region that encodes the CCT domain. Below the gene structure diagram is a gel image of the reverse transcription polymerase chain reaction (PCR) (30 cycles of amplification) showing PCR products of PPD1 cDNA in Bd21-3 and ppd1 mutant plants. The location of primers used in each reaction are shown in the diagram above the gel image. (B) Representative photo of Bd21-3, heterozygous, and homozygous ppd1 plants grown in a 20h LD. Picture was taken 60d after germination in 20h LD, bar = 5cm. (C and D) Flowering time was measured as days to heading (C) and the number of leaves on the parent culm at time of heading (D), ** indicates statistical differences (p < 0.01), *** indicates statistical differences (p < 0.001) by Student’s t-test. (E) Fine mapping of ppd1 in a population of 380 BC1F2 individuals. Individuals with seven different haplotypes were identified by three dCAPS markers and flowering times of each haplotype were determined in the F3 generation. Black, grey, and light grey rectangles represent NAN610, heterozygous, and Bd21-3 genotypes, respectively. Variants around the PPD1 locus from the NAN610 line are shown with black dots, and yellow arrows indicate the coding genes within the mapped interval with the specific effect on the coding region indicated.

