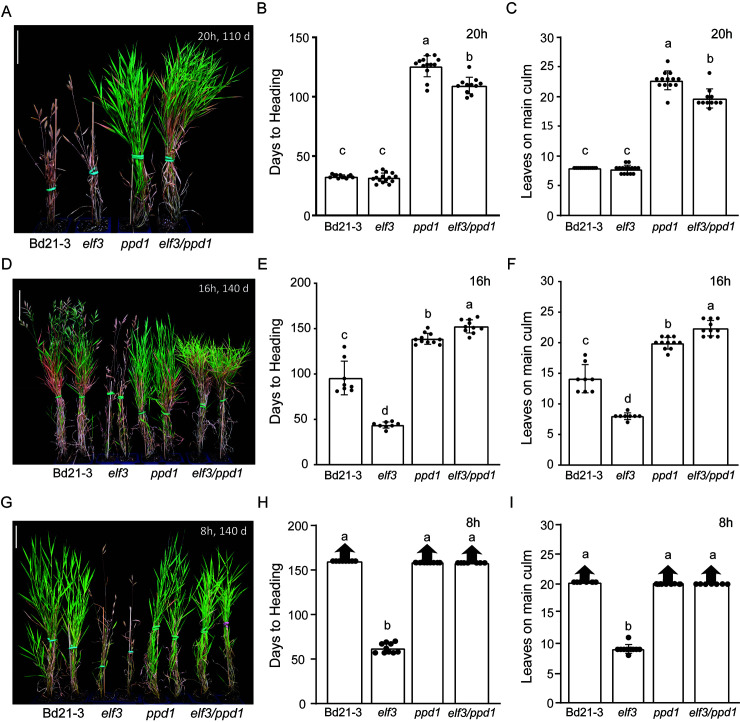
Fig 4. Genetic interactions between the delayed flowering ppd1 mutant and the rapid flowering elf3 mutant.
Representative image of Bd21-3 wild-type, rapid flowering elf3 mutant, delayed flowering ppd1 mutant, and delayed flowering elf3/ppd1 double mutant grown in a 20h photoperiod (A), 16h photoperiod (D), and 8h photoperiod (G). Picture was taken after 110d, for the 20h LD (A) and 140d after germination for the 16h LD and (D) 8h SD. Scale bar = 5cm. (B, E, H) Flowering times under 20h (B), 16h (E), 8h (G) measured as days to heading of Bd21-3, elf3, ppd1, and elf3/ppd1. Flowering times under 20h (C), 16h (F), and 8h (I) measured as the number of leaves on the parent culm at time of heading. The 8h experiment was repeated three times. The first experiment resulted in ppd1 plants that stopped producing new leaves before wild type. One possibility for the cessation of new leaf production in ppd1 plants in this experiment is that the meristem transitioned to flowering, but then did not proceed to heading. However, in two subsequent experiments ppd1 plants continually produced new leaves for the duration of the experiment similar to wild type and this data is shown in (I). Data for all three experiments are shown in S1 Data for Fig 4. When grown under non-inductive conditions for 120 days or more, a few B. distachyon plants flower; we consider this a stochastic flowering response because the majority of plants do not flower. Bars represent the average of 8 plants ± SD. Arrows above bars indicate that none of the plants flowered at the end of the experiment (150d, >20 leaves). Letters (a, b, c, d) indicate statistical differences (p < 0.05) according to a Tukey’s HSD test used to perform multiple comparisons.

