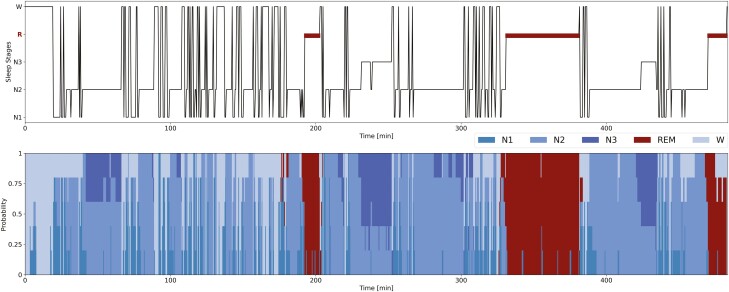
Figure 3.
Hypnogram and hypnodensity-graph from the scorers labels. Example of hypnogram and hypnodensity-graph for a subject from the DOD-H with the highest percentage 14% of N1 sleep stages. For each 30-s epoch we report on top the hypnogram, i.e. the discrete sleep stage values (majority vote from the scorers labels); on bottom the hypnodensity-graph, i.e. the cumulative probabilities of each sleep stage (soft-consensus computed from the scorers labels). The hypnodensity-graph allows us to better appreciate the low level of agreement of a specific sleep stage among the different scorers. In this example, the sleep stages N1 are often associated with a high percentage of residual probability in awake or N2, thus at the transitions from one sleep stage to another.

