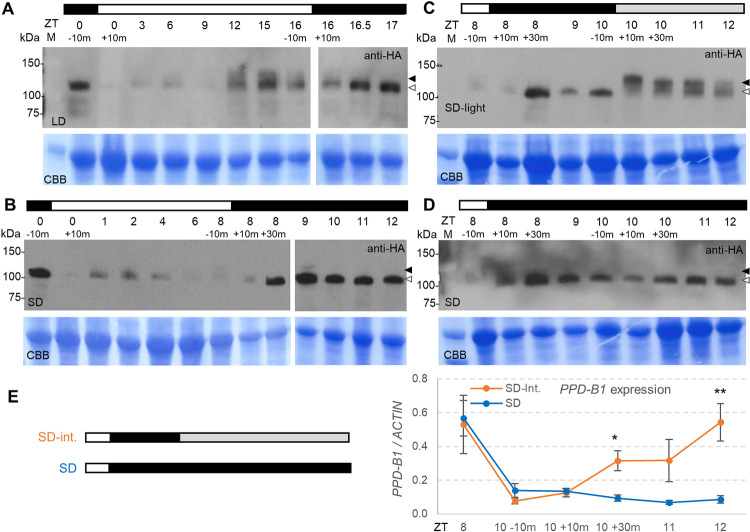
Fig 4. ELF3-HA protein in UBI::ELF3-HA transgenic plants grown under LD, SD and SD interrupted night (SD-int.).
ELF3 protein levels were analyzed by immunoblotting using an anti-HA antibody (samples were harvested at the indicated ZT times). (A) Plants grown under LD. (B) Plants grown under SD. (C) Plants were grown under SD, but on the day when samples were collected, lights were turned on at ZT10, 2 h after the start of the night (SD-int.). (D) Plants under SD grown simultaneously with those in B but without turning on the light before sampling (collected at the same time points as in C). The black arrowhead indicates the higher and more diffuse band and the white arrowhead the sharper lower band detected in the dark. The bottom panel is a Coomassie Brilliant Blue (CBB) stained membrane used as a loading control. The white bar indicates lights on and the black bar lights off. The gray bar in C indicates that the lights were turned on during the subjective night. (E) Quantitative reverse transcription PCR (qRT-PCR) analysis of PPD-B1 expression in leaves collected at the same time points as in C. Raw data and statistics are available in Data C in S1 Data.

