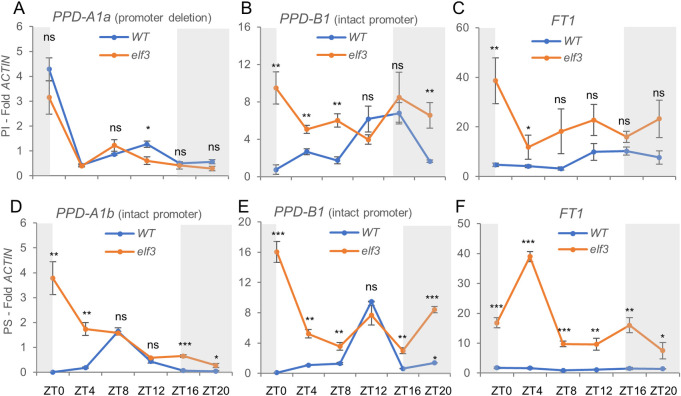
Fig 6. qRT-PCR analysis of transcript levels of PPD1 and FT1 in wildtype and elf3 mutants.
Leaf samples collected from 5-week-old Kronos photoperiod insensitive (PI) and sensitive (PS) plants grown under LD. (A-C) Wildtype vs. elf3 in PI. (D-F) Wildtype vs. elf3 in PS. (A) PPD-A1a allele with a deletion in the promoter associated with earlier heading under SD. (D) PPD-A1b allele with the intact promoter and late heading under SD. (B & E) PPD-B1 with intact promoter in PI and PS. (C & F) FT1 (both homoeologs combined). ACTIN was used as endogenous control. Error bars are s.e.m based on 5 biological replications. ns = not significant, * = P < 0.05, ** = P < 0.01, *** = P < 0.001 based on t-tests between mutants and wildtype at the different time points. Raw data and statistics are available in Data E in S1 Data.

