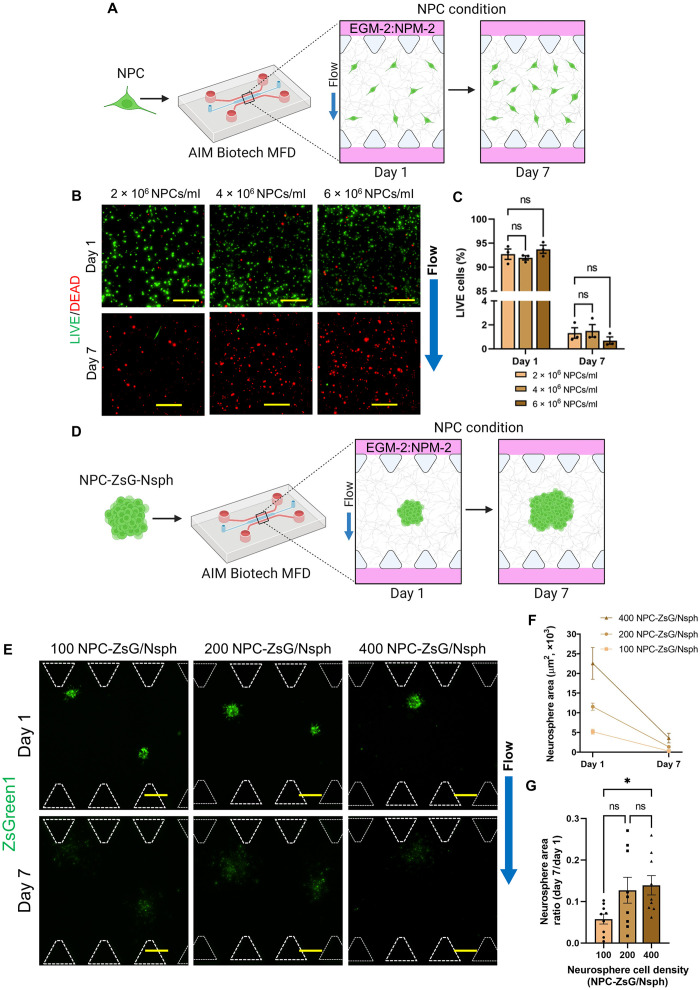
Fig. 2. Dispersed NPCs and NPC-ZsG neurospheres (NPC-ZsG-Nsphs) in MFD culture.
(A) Illustration of dispersed NPC solo-culture in MFDs. NPCs were resuspended in fibrin gels (NPC condition) at three different cell densities within MFDs. Samples were cultured for 1 week in EGM-2:NPM-2 under flow conditions. (B) LIVE (green)/DEAD (red) MIPs of NPCs on day 1 and day 7. NPCs were resuspended in fibrin at 2 × 10⁶, 4 × 10⁶, or 6 × 10⁶ NPCs/ml. (C) Graph of the percentage of LIVE NPCs cultured at different cell densities. The data show mean value, error bars ± SEM, n = 3. (D) Illustration of NPC-ZsG-Nsph solo-culture in MFDs. NPCs-ZsG were aggregated into neurospheres of three different cell densities and resuspended in fibrin gels (NPC condition) within MFDs. Cells were cultured for 1 week in EGM-2:NPM-2 under flow conditions. (E) Fluorescence MIPs of NPC-ZsG-Nsphs (ZsGreen1, green) with cell densities of 100, 200, and 400 NPCs-ZsG per neurosphere (NPC-ZsG per Nsph) cultured in MFDs on day 1 and day 7. White dotted lines outline microposts. (F and G) Graphs showing the change in neurosphere area from day 1 to day 7 (F) and the day 7/day 1 neurosphere area ratio (G) for all neurosphere densities. N = 9 neurospheres were measured from n = 3 MFDs. Scale bars, 200 μm (B) and (E). Blue arrows indicate the direction of IF. (C), (F), and (G) The data show mean value, error bars ± SEM, two-way ANOVA (C) and Welch’s ANOVA (G) with Dunnett’s test; ns, P > 0.05; *P < 0.05.

