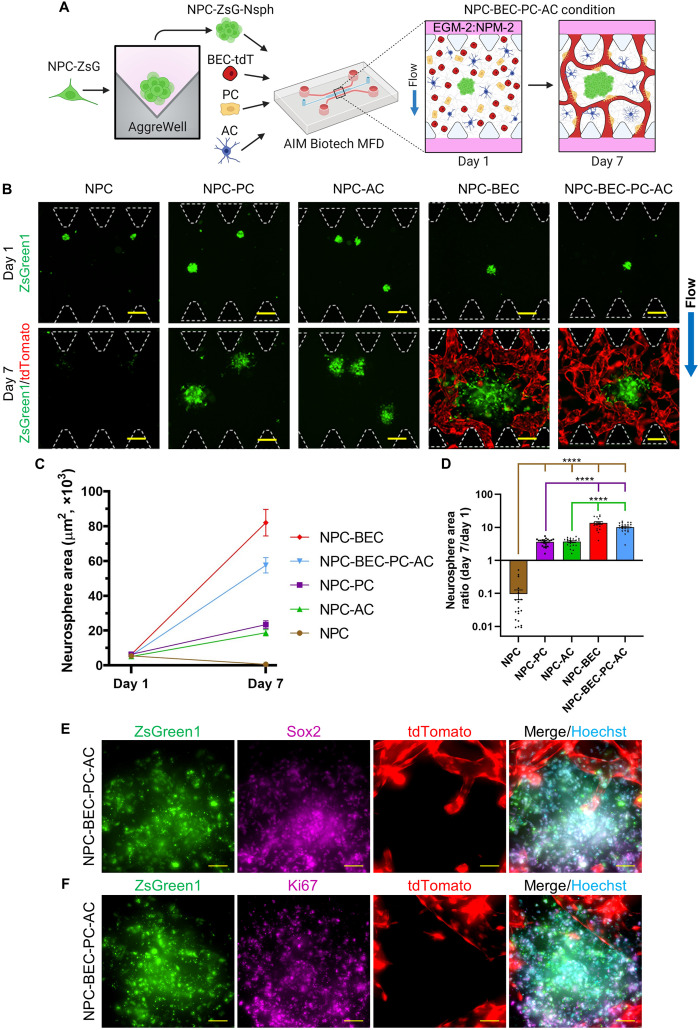
Fig. 3. NPC neurosphere (NPC-Nsph) expansion in MFDs.
(A) Illustration of the culture protocol used to investigate NPC-Nsph expansion. Briefly, NPCs expressing ZsGreen1 (NPCs-ZsG) were aggregated into neurospheres (NPC-ZsG-Nsphs, 200 NPC-ZsG per Nsph) and cultured alone (NPC condition), with PCs (NPC-PC condition), with ACs (NPC-AC condition), with BECs-tdT (NPC-BEC condition), and with all three cell types (NPC-BEC-PC-AC condition) in fibrin gels within MFDs. Samples were cultured for 1 week in EGM-2:NPM-2 under flow conditions. Illustration only shows NPC-BEC-PC-AC condition. (B) Fluorescence MIPs of NPC-ZsG-Nsphs (ZsGreen1, green) cultured in NPC, NPC-PC, NPC-AC, NPC-BEC, and NPC-BEC-PC-AC conditions on day 1 and day 7. BECs-tdT microvessels (tdTomato, red) were only imaged on day 7. PCs and ACs not shown. White dotted lines outline microposts. Blue arrow indicates the direction of IF for all conditions. (C and D) Graphs showing the change in neurosphere area from day 1 to day 7 (C) and the day 7/day 1 neurosphere area ratio (D) for all conditions. N ≥ 18 neurospheres were measured from n = 3 MFDs, the data show mean value, error bars ± SEM, Welch’s ANOVA with Dunnett’s test, the absence of significance line indicates P > 0.05, ****P < 0.0001. Brown, purple, and green significance lines show statistical comparisons made for NPC, NPC-PC, and NPC-AC conditions, respectively. (E and F) Fluorescence MIPs of NPC-ZsG-Nsphs (ZsGreen1, green) expressing Sox2 (E, purple) and Ki67 (F, purple) with microvessels (tdTomato, red) in NPC-BEC-PC-AC conditions on day 7. Nuclei were labeled with Hoechst (blue). Scale bars, indicate 200 μm (B) and 50 μm (E) and (F).

