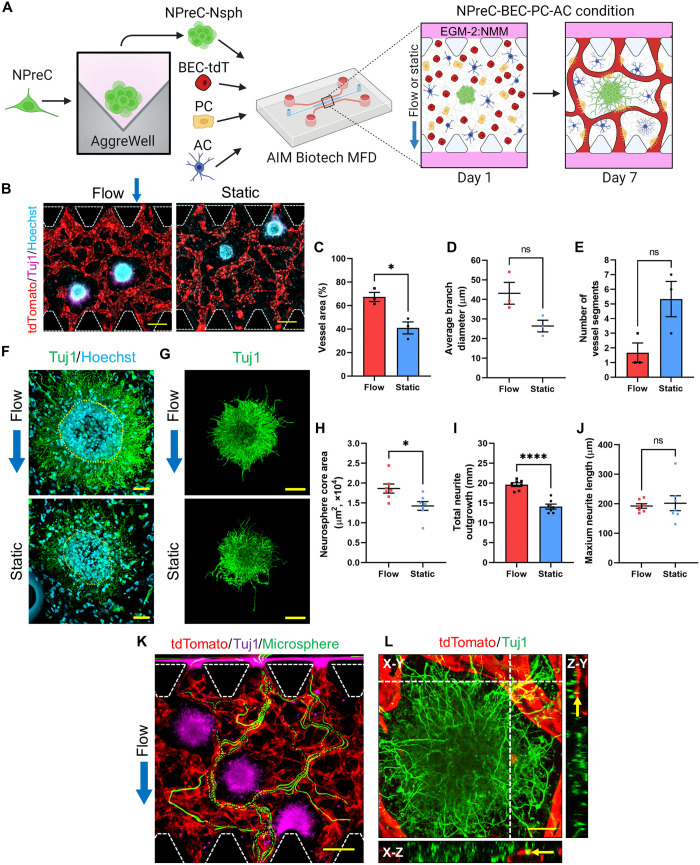
Fig. 7. NPreC-Nsph neurogenesis in MFDs with and without IF.
(A) Illustration of the culture protocol used. (B) Fluorescence MIPs of NPreC-Nsphs (Tuj1, purple) supported by BMVNs composed of BECs-tdT (tdTomato, red) under flow or static conditions on day 7. PCs and ACs not shown. Nuclei labeled with Hoechst (blue). (C to E) Graphs showing the vessel area (C), average branch diameter (D), and the number of vessel segments (E) measured for microvessels. Data from n = 3 MFDs. Welch’s t test; ns, P > 0.05; *P < 0.05. (F) Fluorescence confocal MIPs of NPreC-Nsphs cultured with BMVNs on day 7. NPC-neurons were labeled with Tuj1 (green) and Hoechst (blue). Yellow dotted lines outline neurosphere cores. (G) Large fluorescence confocal MIPs of NPreC-Nsphs (Tuj1, green). Background signals removed to highlight neurites. (H to J) Graphs showing the neurosphere core area (H), total neurite outgrowth (I), and maximum neurite extension (J) measured for NPreC-Nsphs. The data show mean value, error bars ± SEM, data from N = 7 neurospheres from n = 3 MFDs, Welch’s t test; ns, P > 0.05; *P < 0.05; ****P < 0.0001. (K) Fluorescence time-lapse MIP of microspheres (green) flowing through microvessels (tdTomato, red) supporting NPreC-Nsphs (Tuj1, purple) under flow conditions on day 7. (B) and (K) White dotted lines outline microposts. (L) Fluorescence confocal MIP of NPC-neurons (Tuj1, green) with microvessels (tdTomato, red) under flow conditions. Yellow arrows identify microvessel-neurite contact. Scale bars, 200 μm (B) and (K), 50 μm (F) and (L), and 100 μm (G). Blue arrows indicate direction of IF.

