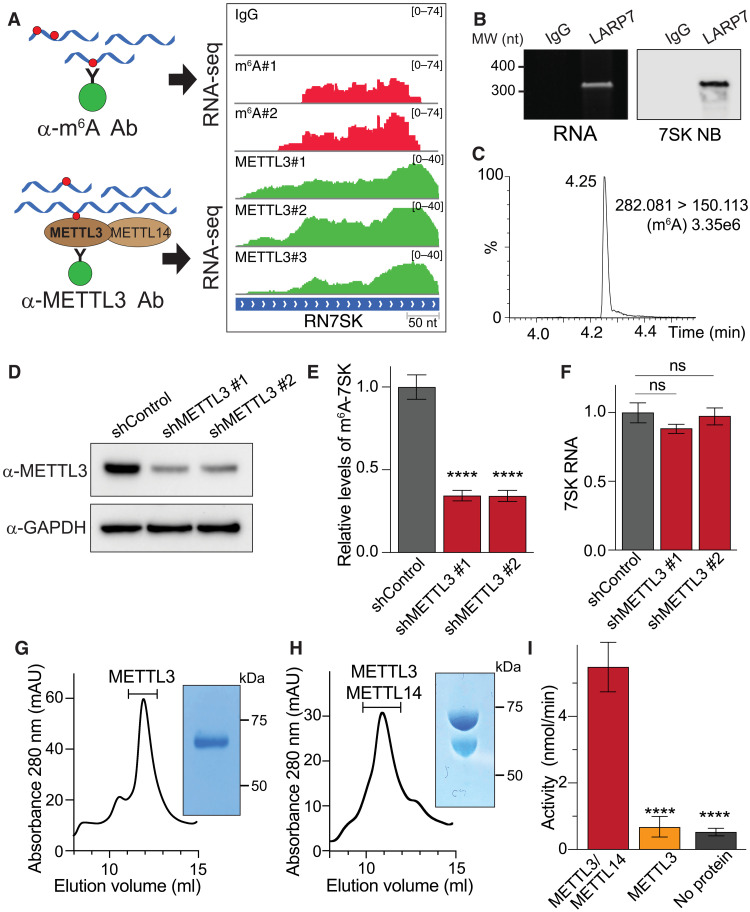
Fig. 1. 7SK is m6A methylated by METTL3.
(A) Tracks of m6A-seq and METTL3 HITS-CLIP on 7SK. The top shows an immunoglobulin G (IgG)–negative control. On the left, a schematic representation of the experiments. Ab, antibody. (B) Isolation of endogenous 7SK by IP of Flag-tagged LARP7. Purified endogenous 7SK as shown by a urea-acrylamide gel (left) and Northern blot (right). IgG was used as controls. MW, molecular weight; nt, nucleotide; NB, Northern blot. (C) Detection of m6A in 7SK through UHPLC-MS/MS. The figure shows a representative spectrum from three biological replicates. (D) Knockdown of METTL3 using two independent shRNAs. Total cell extracts were analyzed by Western blot using the indicated antibodies. (E) m6A-methylated nuclear RNA was immunoprecipitated and the levels of 7SK were quantified by quantitative reverse transcription polymerase chain reaction (qRT-PCR). Total endogenous 7SK levels were used for normalization. The graph shows means ± SD from three biological replicates. One-way analysis of variance (ANOVA) with Dunnett’s posttest; ****P < 1 × 10⁻⁴. (F) Normalized levels of 7SK were quantified by qRT-PCR. The bar graph depicts the effect of METTL3 depletion using two independent shRNAs. The graph shows means ± SD from three biological replicates. One-way ANOVA with Dunnett’s posttest. (G and H) METTL3 (G) and METTL3/METTL14 protein complexes (H) were expressed in insect cells, affinity-purified using Ni beads, and separated using size exclusion chromatography. The inset shows a representative image of a Coomassie staining of SDS–polyacrylamide gel electrophoresis (SDS-PAGE) from one of the fractions corresponding to the peak (indicated in the chromatogram, absorbance 280 nm was measured in milli-absorbance units (mAU). (I) Methylation of in vitro–transcribed (IVT) 7SK using proteins obtained from (G) and (H). The graph shows means ± SD from a representative experiment out of three biological replicates. One-way ANOVA with Dunnett’s posttest; ****P < 1 × 10⁻⁴.

