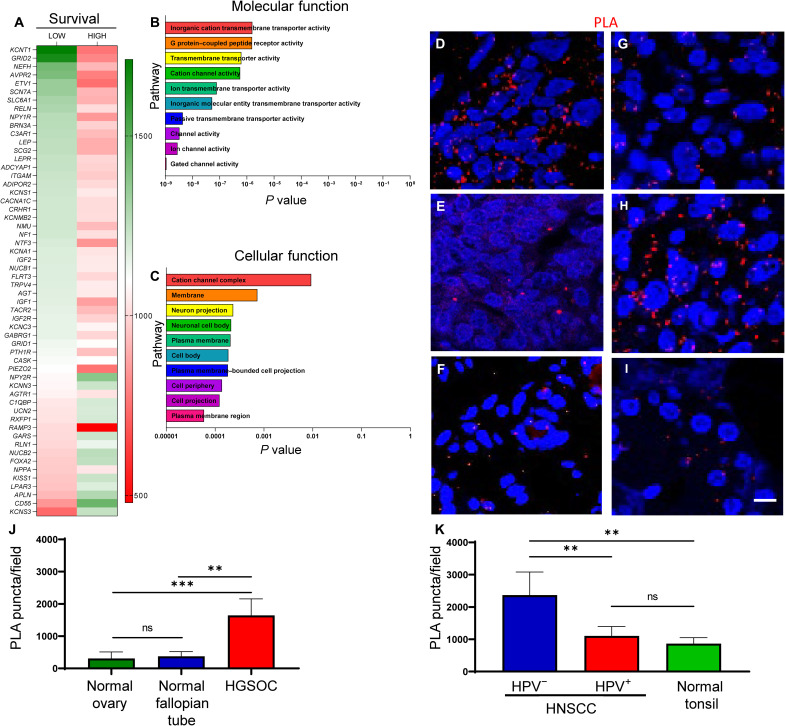
Fig. 1. Neuronal gene expression correlates with survival, neuronal pathways, and synapse-like structures in tumors.
Heatmap of neuronal genes expressed by ovarian cancers from OncoLnc, Gepia2, and Oncomine datasets (A). Correlations between gene expression and patient survival shown. GO enrichment analysis of neuronal genes demonstrating significant pathways important for molecular (B) and cellular (C) functions in ovarian cancers. Representative en face confocal images of HGSOC (n = 4) (D), normal ovary (n = 2) (E), normal fallopian tube (n = 2) (F), HPV+ HNSCC (n = 4) (G), HPV− HNSCC (n = 4) (H), and normal tonsil (n = 2) (I) stained by PLA for neurexin-3 and neuroligin-1. Red, positive PLA signal. Blue, 4′,6-diamidino-2-phenylindole nuclear stain. Scale bar, 100 μm. Quantification of PLA-positive signals from normal ovary, normal fallopian tube, and HGSOC (J) as well as HPV−, HPV+, and normal tonsil (K). Statistical analysis by unpaired Student’s t test. **P < 0.05; ***P < 0.01; ns, not significant.

