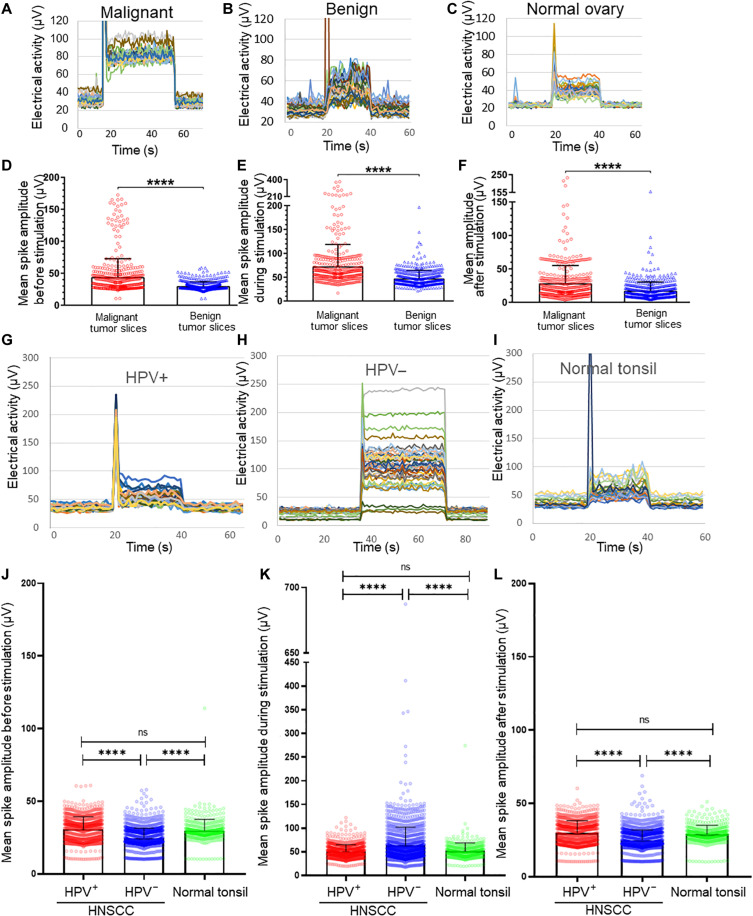
Fig. 2. MEA analysis of tumors.
Snapshots of representative MEA recordings from malignant HGSOC (n = 13 cases) (A), benign gynecologic tumor (n = 5 cases) (B), and normal ovary (n = 2 cases) (C) patient samples before, during, and after stimulation. MEA quantification comparing malignant and benign disease at baseline (D), during evoked activation (E), and after removal of the artificial stimulus (F). Snapshots of representative MEA recordings from n = 2 HPV+ cases (G), n = 4 HPV− cases (H), and n = 2 normal tonsils (I) before, during, and after stimulation. Quantification of MEA data comparing baseline (J), during evoked activation (K), and after removal of the artificial stimulus (L). Signals from all electrodes and all tissue slices were pooled, averaged, and compared. Statistical analysis by one-way analysis of variance (ANOVA). SD, error bars. ****P < 0.0001. N ≥ 4 slices per sample were generated on the basis of tumor size.

