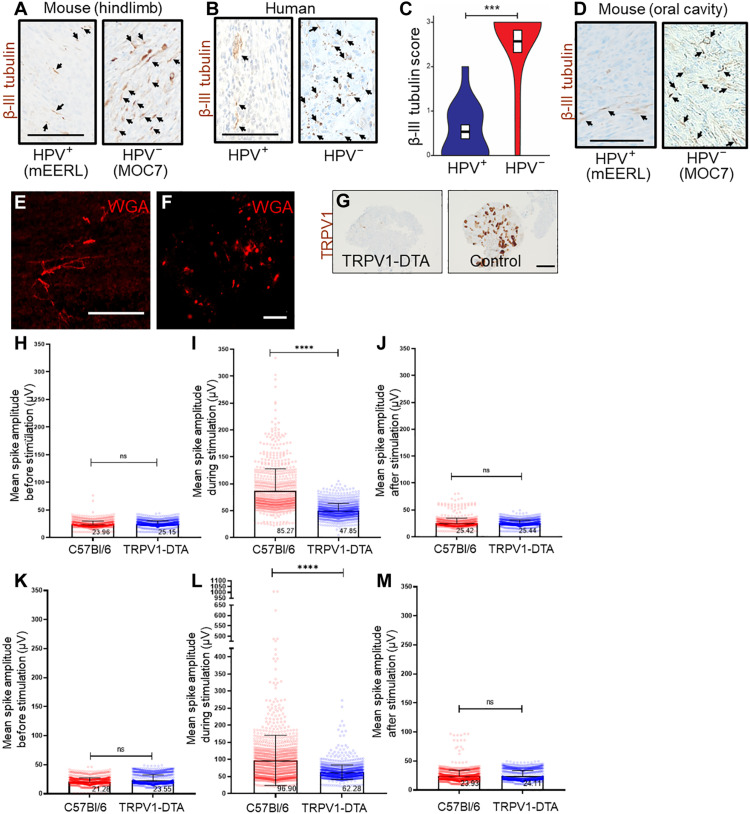
Fig. 3. Electrical activity from TRPV1-expressing neurons.
Photomicrographs of murine [(A), hindlimb] and human (B) HPV+ and HPV− HNSCCs immunohistochemically stained for β-III tubulin (brown). Arrows, positively stained intratumoral nerves. Scale bar, 100 μm. (C) Quantification of β-III tubulin score; score of 0, no positive staining; score of 1 indicates 10% positive staining; score of 2 indicates 30% positive staining; score of 3 indicates more than 30% positive staining. N = 15 cases each of HPV+ and HPV− HNSCCs. Statistical analysis by Student’s t test. ***P < 0.0001. Representative photomicrograph of orthotopic mEERL (HPV+) and MOC7 (HPV−) tumors IHC stained for β-III tubulin (arrowheads) (D). Scale bar, 100 μm. En face confocal image of orthotopic MOC7 (HPV−) tumor injected with wheat germ agglutinin (WGA) neural tracer. Tracer+ (red) nerves in the tumor bed (E) map to the ipsilateral TGM ganglion (F). Scale bar, 200 μm. (G) Photomicrographs of DRG from TRPV1cre::DTAfl/WT (TRPV1-DTA) and C57Bl/6 (control) mice IHC stained for TRPV1 (brown). Scale bar, 100 μm. MEA analysis of Trp53−/−;Pten−/− [HGSOC, (H) to (J)] and MOC7 [HPV− HNSCC, (K) to (M)] tumors subcutaneously implanted into either C57Bl/6 or TRPV1cre::DTAfl/WT (TRPV1-DTA) animals. Signals from all electrodes and all tissue slices were pooled, averaged, and compared. Statistical analysis by one-way ANOVA. SD, error bars. ****P < 0.0001.

