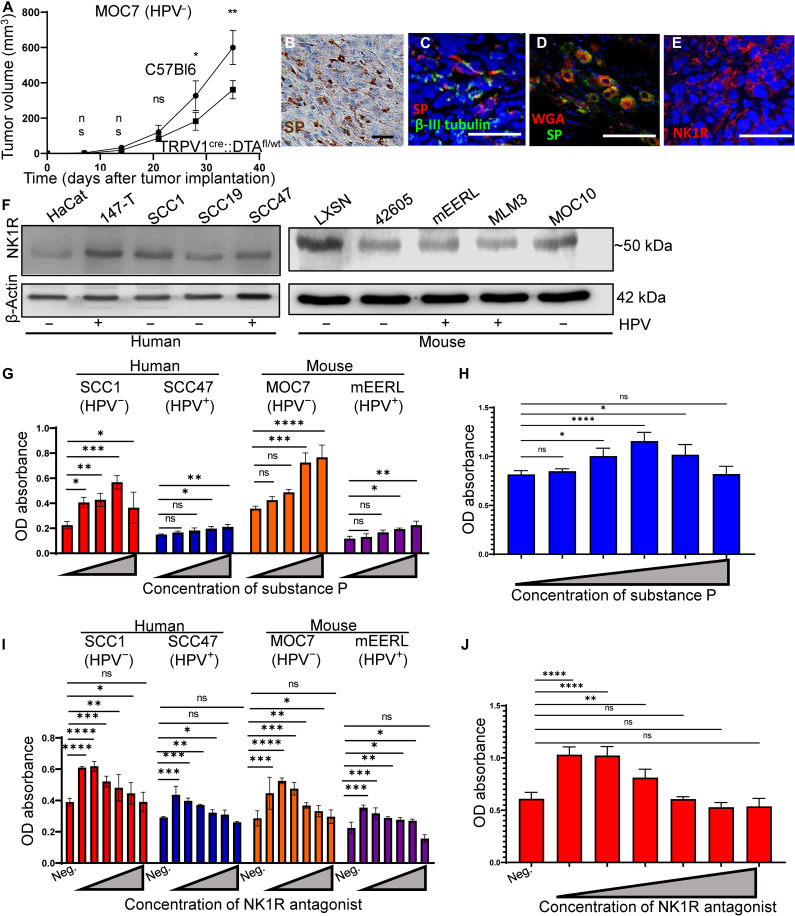
Fig. 4. SP induces tumor cell proliferation.
(A) Tumor growth curve of MOC7 (HPV−) tumors orthotopically implanted into C57Bl/6 (control) or TRPV1cre::DTAfl/WT mice (n = 10 mice per group). Statistical analysis by multiple Student’s t test. **P < 0.01; *P < 0.05. (B) Photomicrograph of HNSCC (n = 4 cases) IHC stained for SP (brown). Scale bar, 50 μm. (C) En face confocal image of a HNSCC patient sample immunofluorescently stained for SP (red) and β-III tubulin (green). N = 4 tumors analyzed with similar results. Scale bar, 100 μm. (D) Ipsilateral TGM ganglion from tracer injected MOC7 (HPV−) tumor showing colocalization of tracer (red) and SP (green). Scale bar, 50 μm. (E) Representative en face confocal images of HNSCC patient sample immunofluorescently stained for NK1R (red) (n = 4 patient samples). Scale bar, 100 μm. (F) Western blot analysis of whole cell lysates from the indicated HNSCC cell lines for NK1R. β-Actin, loading control. Cellular proliferation of the indicated HNSCC (G) or HGSOC (H) cell lines in response to increasing concentrations of SP for 24 hours or with inclusion of an anti-NK1R antagonist that inhibits this effect [(I), HNSCC; (J), HGSOC]. Statistical test by one-way ANOVA with post hoc Tukey test. *P < 0.05, **P < 0.01; ***P < 0.001; ****P < 0.0001. OD, optical density.

