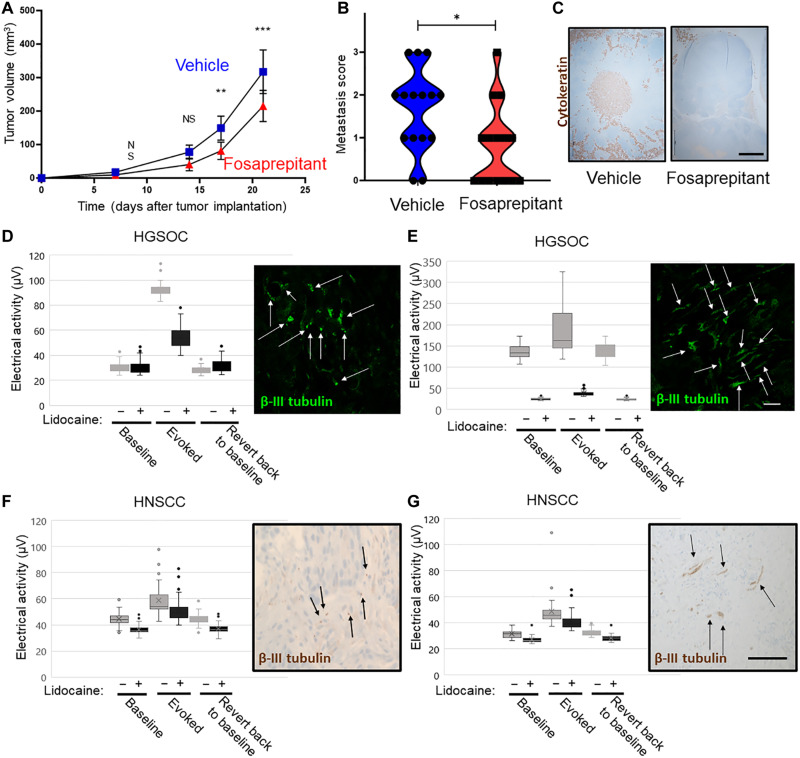
Fig. 6. Pharmacologic blockade of neuronal function.
(A) Tumor growth curve of C57Bl/6 mice orally implanted with MOC7 (HPV−) tumors and treated with vehicle or fosaprepitant. N = 10 mice per group. Statistical analysis by Student’s t test. **P < 0.01; ***P < 0.001. (B) Quantification of metastases in the draining lymph nodes of mice from experiment in (A). (C) Representative photomicrographs of draining lymph nodes from the indicated conditions from mice in experiment A. Brown, cytokeratin IHC staining. Scale bar, 500 μm. Representative examples of HGSOC (D and E) and HNSCC (HPV−) (F and G) electrical activity of tumor slices before and after treatment with lidocaine. Gray bars, before lidocaine; black bars, after lidocaine. N = 7 cases of HGSOC and n = 2 cases of HNSCC were evaluated. Insets, immunofluorescent (D and E; green; scale bar, 10 μm) or immunohistochemical (F and G; brown; scale bar 20 μm) staining for β-III tubulin of each sample. Arrows highlight nerves.

