
Extended Data Figure 7|. Supporting data that TBK1 inhibition lowers the cytotoxicity threshold to TNFα/IFNγ.
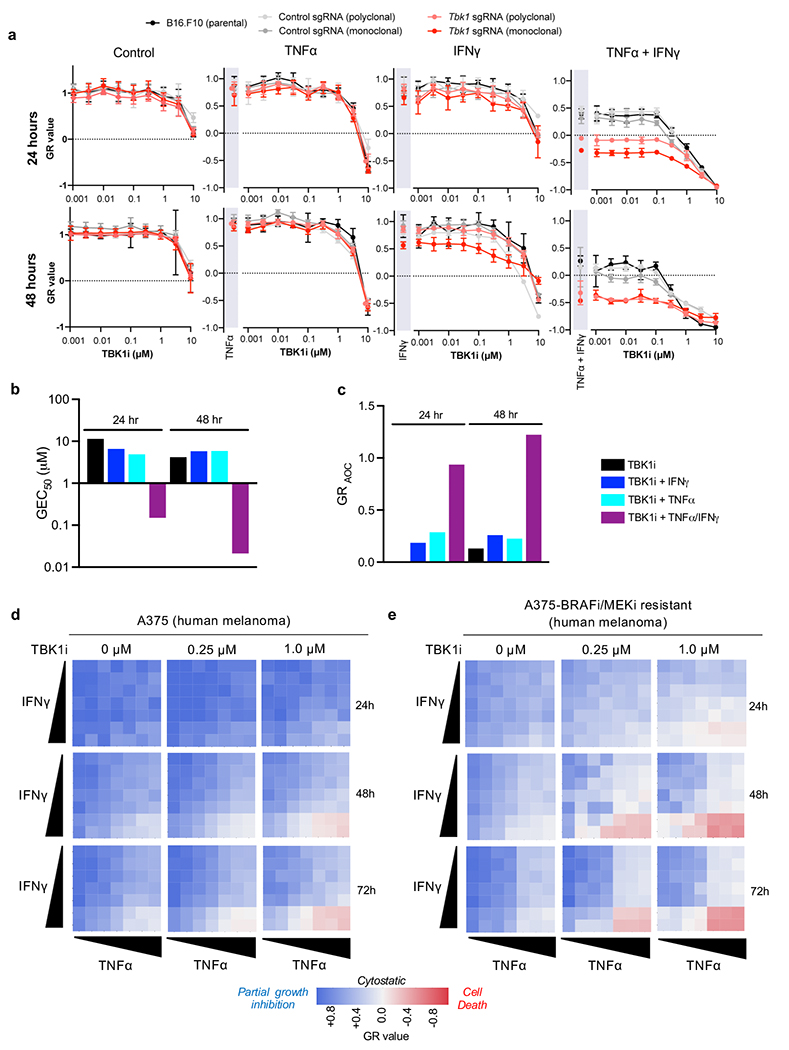
a, GR values for 9-point inhibitor titration of TBK1i in parental, control sgRNA (polyclonal and monoclonal), and Tbk1 sgRNA (polyclonal and monoclonal) B16 cells (2 independent experiments; representative data from single experiment with 6 technical replicates per condition). Means (solid circles) are shown +/− s.e.m (error bars). b-c, evaluation of TBK1i potency (b; half-maximal effect, GEC50) and overall efficacy (c; area over the GR curve, GRAOC) d-e, Heatmap of GR values for parental (d) and BRAF/MEK inhibitor resistant (e) A375 human melanoma cells treated with increasing concentrations of TNFα and IFNγ for 24, 24, and 72 hours with 0, 0.25, and 1.0 μM TBK1i (n=3).