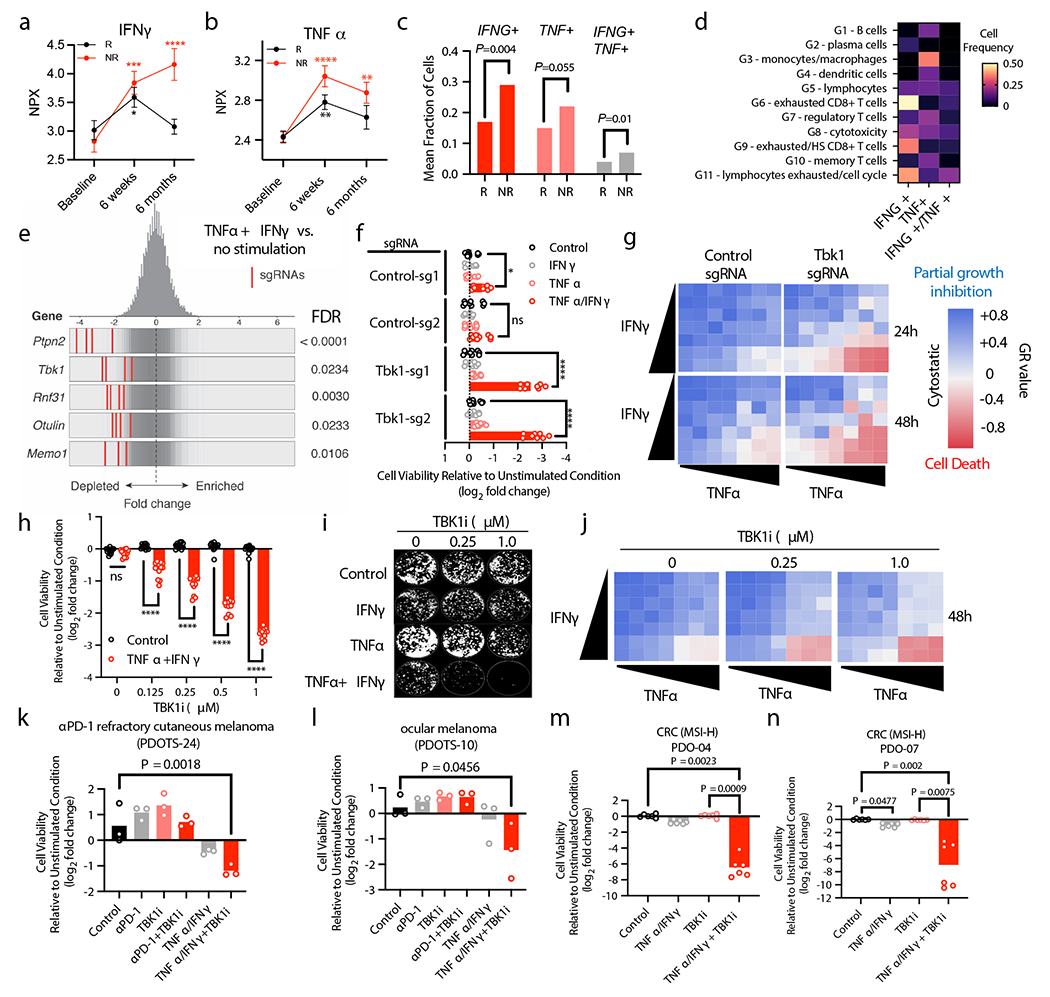
Figure 4|. Loss of TBK1 sensitizes tumour cells to TNFα/IFNγ.

a-b, Plasma protein levels (NPX, normalized protein expression) from patients with metastatic melanoma responsive (R) or non-responsive (NR) to ICB at baseline (n=179), 6 weeks after starting ICB (n=173) and 6 months after starting ICB (n=151). Mean values (solid circles) +/− s.e.m. are shown (2-way ANOVA with Dunnett’s multiple comparisons test: **P < 0.01; ***P < 0.001; **** P <.0001). c-d, Mean fraction of CD45+ cells (c) and cell frequency across lineage-defined clusters (d) for cells expressing IFNG and TNF in patients with metastatic melanoma20. e, Frequency histograms of depletion (z-score) for all sgRNAs per target in a Cas9+ B16 control sgRNA cell line +/− in vitro stimulation with TNFα and IFNγ. f, Viability assessment of indicated B16 cell lines with indicated treatments (24 hours). Means (bars) and individual values (open circles) are shown (n=9, 3 independent experiments, 2-way ANOVA, Dunnett’s multiple comparisons test: * P <.05, **** P <.0001, ns, not significant). g, Heatmap of mean GR values (n=3) for cells treated with increasing concentrations of TNFα and IFNγ. h, Viability assessment of B16 cells with indicated treatments compared to unstimulated cells (24 hours). Means (bars) and individual values (open circles) are shown (n=12, 4 independent experiments, 2-way ANOVA, Dunnett’s multiple comparisons test: **** P <.0001, ns, not significant). i, Clonogenic assay of B16 cells (representative images shown; n=3). j, Heatmap of GR values for B16 cells treated with TBK1i (n=3) across TNFα/IFNγ concentrations. k-l, PDOTS viability assessment with indicated treatments. Means (bars) and individual values (open circles) are shown (n = 3, one-way ANOVA with Dunn’s multiple comparisons test). m-n, patient-derived organoids with indicated treatments. Means (bars) and individual values (open circles) are shown (n=6 biological replicates, 2 independent experiments: one-way ANOVA with Dunn’s multiple comparisons test).
