
Extended Data Figure 4|. Effect of Tbk1 deletion on the tumour immune microenvironment.
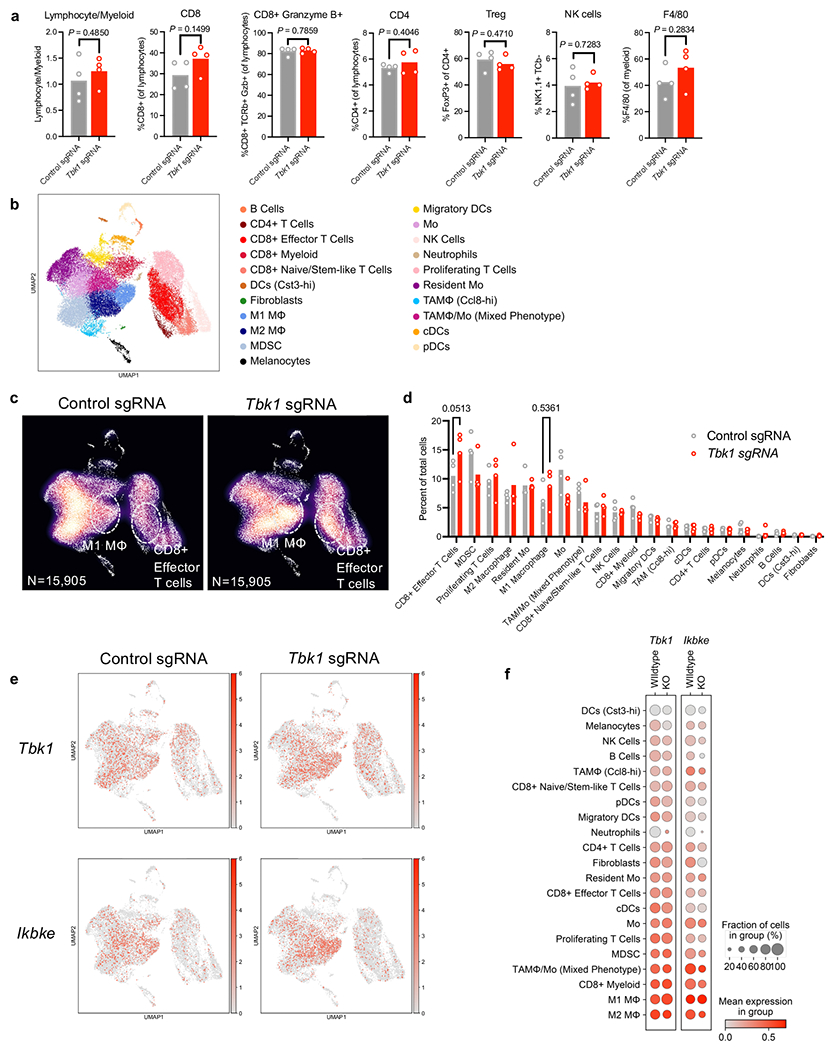
a, Flow cytometry of immune populations from control and Tbk1-null B16 tumours treated with anti-PD-1 (n=4 per group). Means (bars) and individual values (open circles) are shown (n = 4 biologically independent samples, 2-sided unpaired t-test). b-c, UMAP (b) and density (c) plots of 31,810 RNA-sequenced single cells from control and Tbk1-null B16 tumours following anti-PD-1 treatment (DC, dendritic cells; Tregs, regulatory T cells; MDSC, myeloid-derived suppressor cell; NK, natural killer cells; M1, M1 macrophages; M2, M2 macrophages). d, percent of cells in each lineage-defined cluster. Means (bars) and individual values (open circles) are shown (n = 4 biologically independent samples, 2-way ANOVA, Sidak’s multiple comparisons test; P values shown for M1 macrophages and CD8 T cells that did not reach statistical significance). e, UMAP plot of RNA-sequenced single cells with colouring of Tbk1 and Ikbke expression with cell types referenced (b). f, bubble plot indicating Tbk1 and Ikbke expression across UMAP-defined cell clusters.