. 2023 Apr 25;12:e88080. doi: 10.7554/eLife.88080

Figure 1. Summary of sex differences in mouse and human CR research.

PubMed was searched using MeSH terms to identify research articles that studied caloric restriction in vivo in mice (A,B) or humans (C,D), published between 2003 and 2021. Search results were then classified into the following groups depending on the sexes included in each study: ‘Male only’=male subjects used exclusively; ‘Female only’=female subjects used exclusively; ‘Male & Female separate’=male and female subjects used with data reported respective to each sex, allowing sex differences to be addressed; ‘Male & female combined’=male and female subjects used with data from both sexes combined either in part or in full; ‘N/A’=no sex data available. (A,C) Cumulative publications for studies within each group. The boxes between (A) and (C) highlight the dates of funders’ policies highlighting the importance of sex as a biological variable. (B,D) Pie charts of those studies in the ‘Male & Female separate’ group that considered sex a biological variable, and the proportion of these that did or did not detect sex differences. Source data are provided as a Source Data file. See also Figure 1—figure supplement 1.

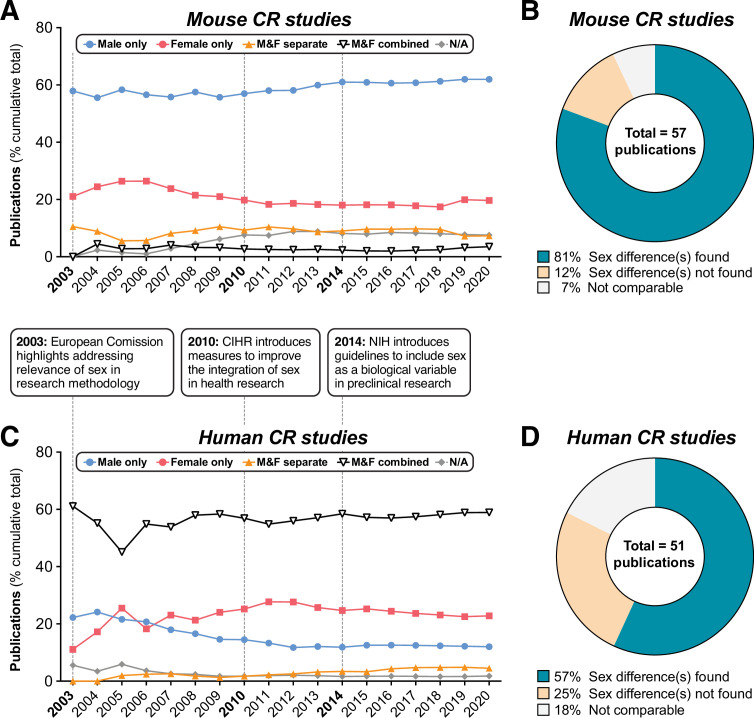
Figure 1—source data 1. Literature search to identify sex differences in mouse and human CR research.
Values for the data presented in Figure 1A–D are shown in the file named ‘Figure 1_Source_Data.xlsx’. Raw data for the literature searches for mice and humans are contained in the files named ‘Literature_Search_Mice.xlsx’ and ‘Literature_Search_Humans.xlsx’.

Figure 1.

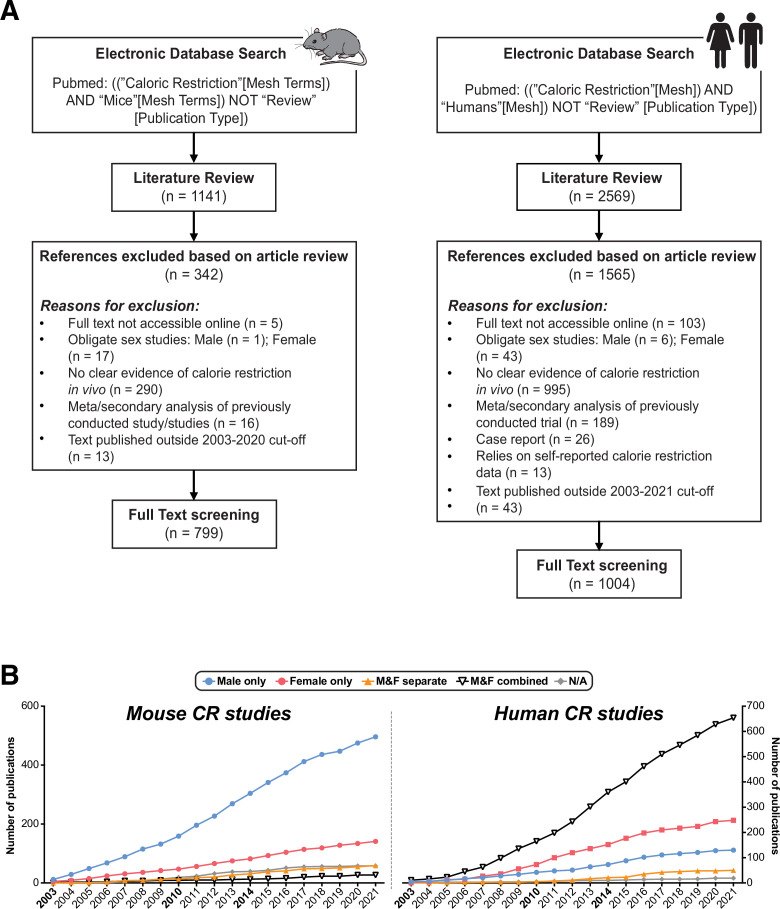
Figure 1—figure supplement 1. Methods used and additional outcomes relating to the comprehensive review of the CR literature.

Figure 1—figure supplement 1.

The NIH PubMed database was searched using MeSH terms to identify research articles that studied CR in vivo in mice or humans, published between 2003 and 2021. (A) Method of database search presented as a flow diagram, including search terms, reasons for exclusion, and number of results in each category. (B) Percentage of mouse or human publications for each year, with publications classified into each group as described for Figure 1. Source data for (B) are provided as a Source Data file.
Figure 1—figure supplement 1—source data 1. Additional outcomes relating to the comprehensive review of the CR literature.
Values for the data presented in Figure 1—figure supplement 1B are shown in the file named ‘Figure 1-figure supplement 1_Source_Data.xlsx’.