Figure 10. Effects of CR on body mass and body composition in humans are sex- and age-dependent.
Twenty male and 22 female volunteers participated in a weight loss study involving a 4-week dietary intervention. (A–F) Body mass was recorded each week (A,B). Fat mass (FM) and fat-free mass (FFM) were measured by air-displacement whole-body plethysmography at weeks 0 and 4 (C–F). Body mass, fat mass, and fat-free mass are shown as absolute masses (A,C,E) or fold-change relative to baseline (B,D,F). Data are presented as mean ± SEM. For (A–C) and (E), significant effects of time, sex, and time*sex interaction were assessed using two-way ANOVA. In (B), (D) and (F), significant differences between males and females at each time point were determined by Šídák’s multiple comparisons test (B) or unpaired T-test (D,F) and are indicated by * (p<0.05) or ** (p<0.01). (G–I) Simple linear regression of age vs fold-change (week 4 vs week 0) in body mass (G), fat mass (H) and fat-free mass (I). For each sex, significant associations between age and outcome (fold-change) are indicated beneath each graph as ‘P, Slope’. ANCOVA was further used to test if the age-outcome relationship differs significantly between males and females. ANCOVA results are reported beneath each graph as ‘P, Slope’ and ‘P, Intercept’ for males vs females (M vs F). In (G), similar slopes but different intercepts show that sex significantly influences weight loss, but the influence of age does not differ between the sexes. In (H,I) the slopes differ significantly, indicating that the age-outcome relationship differs between the sexes. (J–L) Fold-change (week 4 vs week 0) in body mass (J), fat mass (K) and fat-free mass (L) for males vs females separated into younger (<45 years) and older (>45 years) groups. Data are presented as violin plots overlaid with individual data points. Significant effects of age, sex, and age*sex interaction were assessed using two-way ANOVA with Tukey’s multiple comparisons test. Overall p values for each variable, and their interactions, are shown beneath each graph. Significant differences between comparable groups are indicated by * (p<0.05) or *** (p<0.001). Source data are provided as a Source Data file. See also Table 2 and Figure 10—figure supplements 1–3.

Figure 10—figure supplement 1. Baseline fat mass or BMI do not influence sex differences in the effects of CR on body mass or body composition.

Figure 10—figure supplement 2. CR-induced fat loss in mice is age- and sex-dependent.
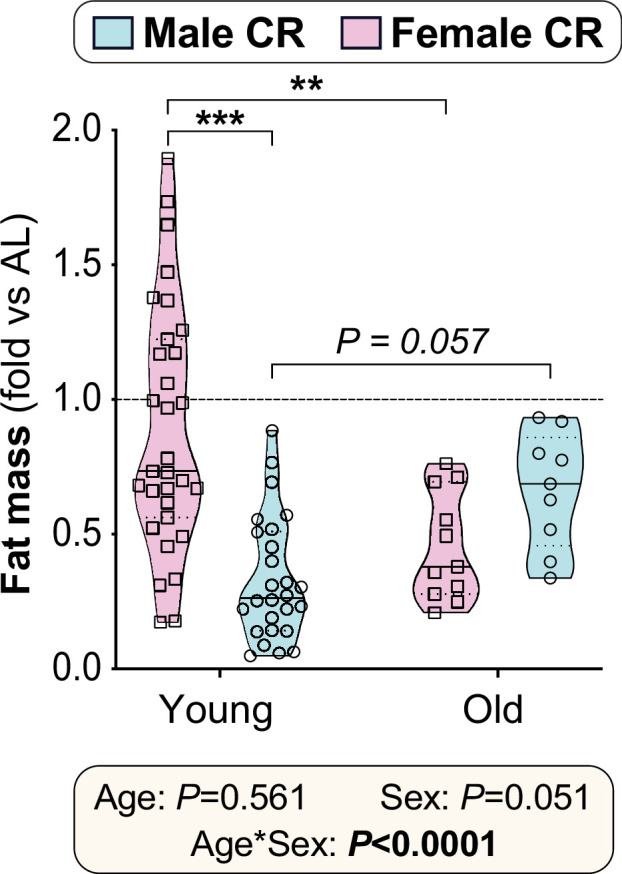
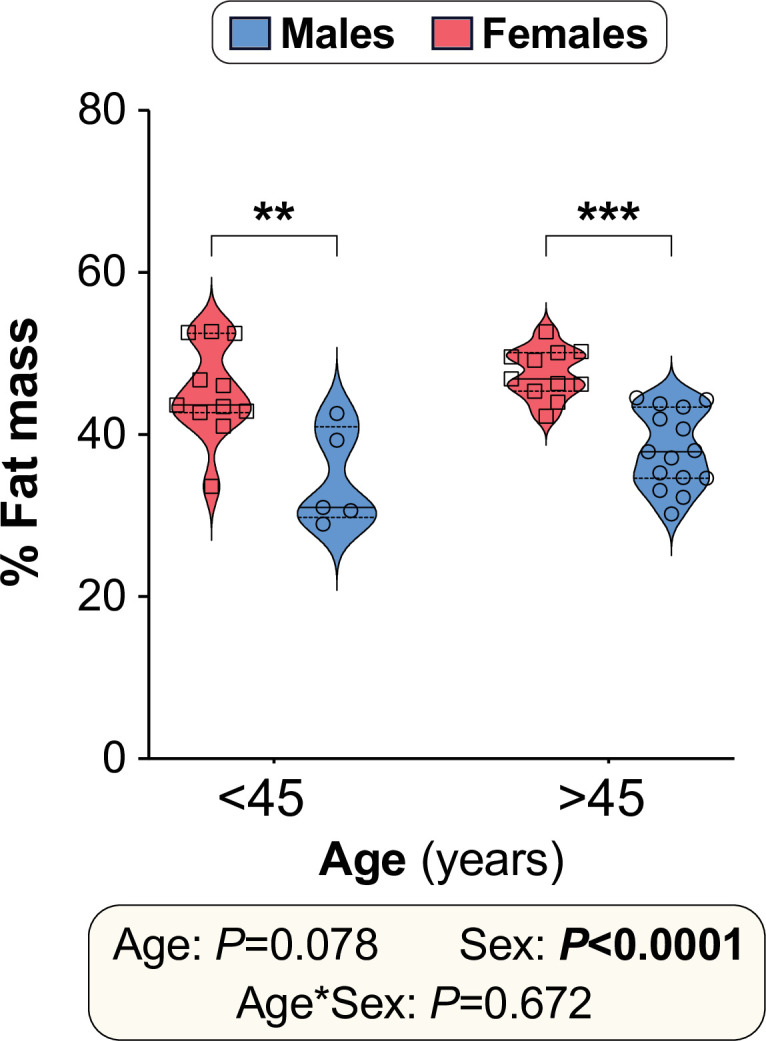
Figure 10—figure supplement 3. Body fat percentage in human CR participants.