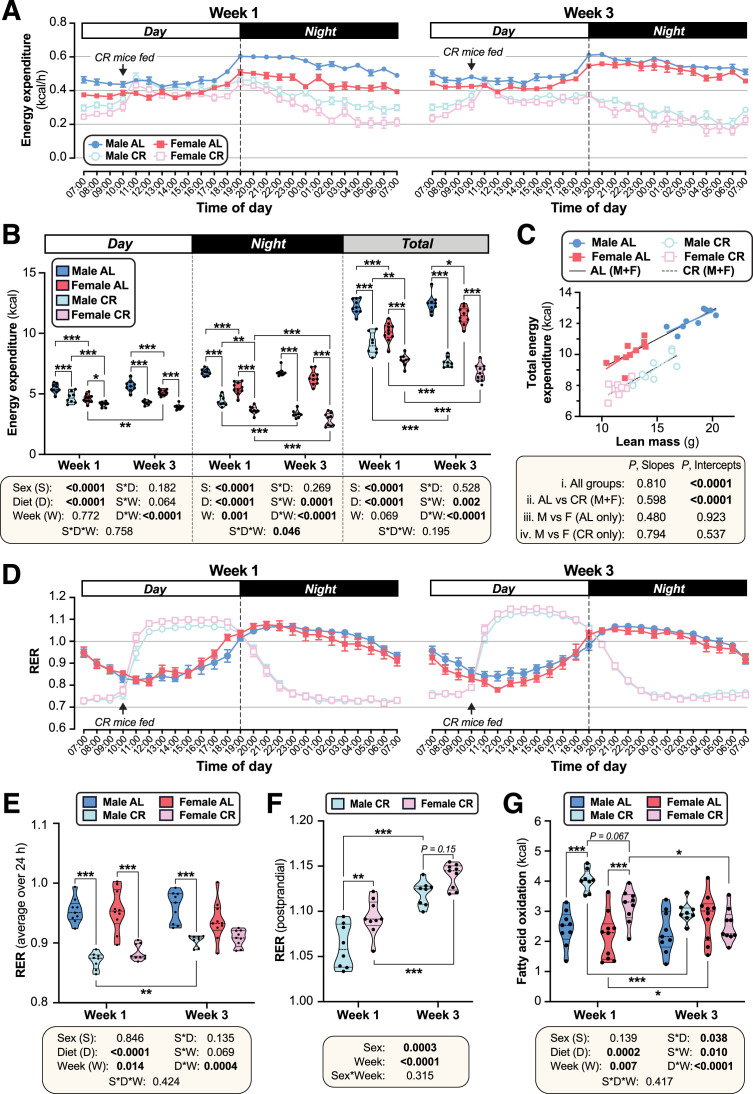
Figure 3. CR decreases energy expenditure and stimulates postprandial lipogenesis more in female than in male mice.
Male and female mice were fed AL or CR diets, as described for Figure 2. In week 1 and week 3 after beginning AL or CR diets, mice were housed for 4 days in Promethion CORE System cages for indirect calorimetry. Energy expenditure (A–C) and respiratory exchange ratio (RER; D–F) was recorded every minute throughout the 4 days. (A,D) Average energy expenditure (A) (kcal) or RER (D) per hour over the 24 hr light (Day) and dark (Night) periods, based on the average for days 2–4 of Promethion housing, for Week 1 (left) and Week 3 (right). (B) Overall energy expenditure (kcal) during the day, night, or day +night (Total) for Week 1 and Week 3. (C) Linear regression of lean mass vs total energy expenditure (kcal/24 h) during Week 1. (E) Average total RER (day +night) in Weeks 1 and 3. (F) Average RER during the postprandial period, from 12.00 to 17.00, for CR mice. (G) Absolute FA oxidation was determined based on energy expenditure and RER as described (Bruss et al., 2010). Data are from 10 (female AL), 9 (female CR, male AL) or 8 (male CR) mice per group. In (A) and (D), data are shown as mean ± SEM. In (B) and (E–G), data are shown as violin plots overlaid with individual data points; within each time period (day, night, or total), significant effects of sex, diet, week, and interactions thereof, were determined by three-way (B,E,G) or two-way ANOVA (F), with p values shown beneath each graph. Statistically significant differences between comparable groups were further assessed by Šídák’s (B,E,G) or Tukey’s (F) multiple comparisons tests and are indicated by * (p<0.05), ** (p<0.01), or *** (p<0.001). For linear regression in (C), ANCOVA was used to test if the relationship between lean mass and total energy expenditure differs significantly across all of the individual diet-sex groups (i. All mice); between AL and CR mice, irrespective of sex (ii. AL vs CR (M+F)); and between males and females fed AL diet (iii) or CR diet (iv) only. ANCOVA p values for differences in slope and intercept are reported beneath the graph. See also Figure 3—figure supplements 1–2.


