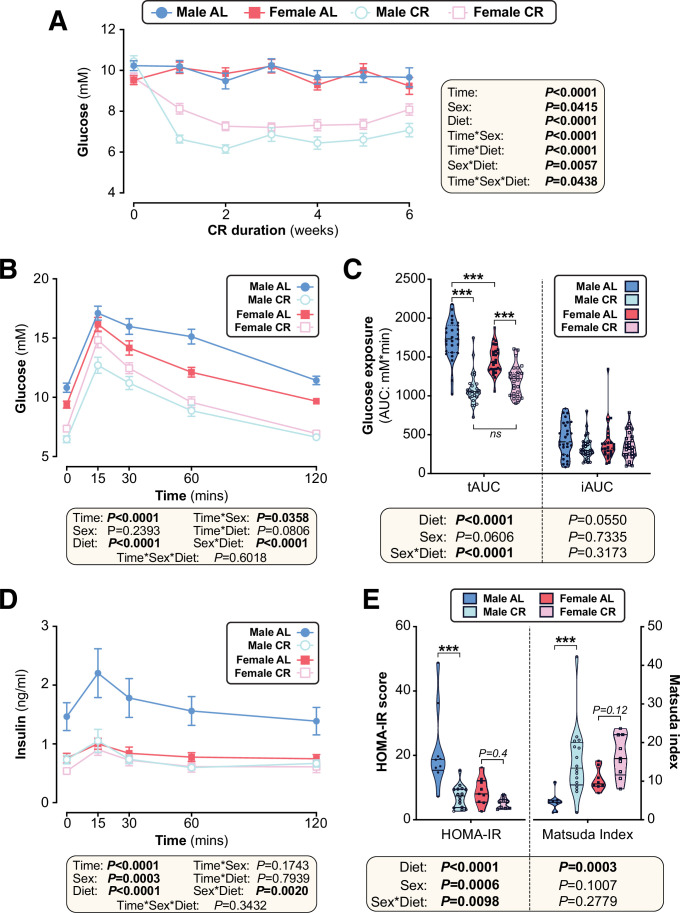
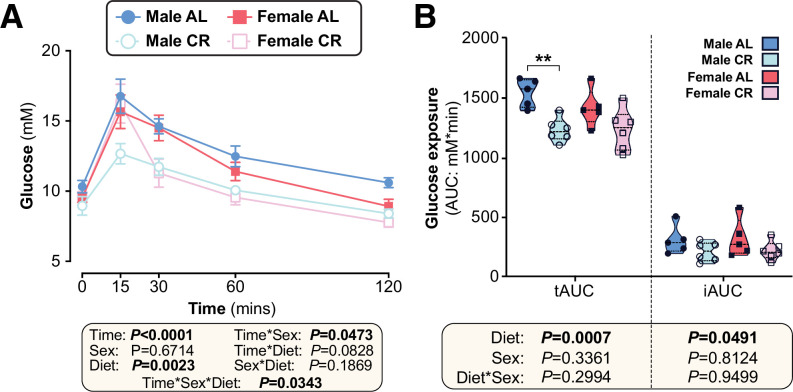
Figure 4. The effects of CR on glucose homeostasis differ between young male and female mice.
Male and female C57BL6/NCrl mice were fed AL or CR diet from 9 to 15 weeks of age, as described for Figure 2. (A) Random-fed blood glucose was recorded each week. (B–D) At 13 weeks of age, mice underwent an oral glucose tolerance test (OGTT). (B) Blood glucose readings during the OGTT. (C) Area under the curve (AUC) during the OGTT was determined relative to 0 mmol/L (total AUC: tAUC) and relative to baseline (incremental AUC: iAUC). (D) Glucose-stimulated insulin secretion in mice during OGTT was assessed using an insulin ELISA. (E) HOMA-IR and Matsuda indices of mice calculated from glucose and insulin concentrations during the OGTT. Data in (A), (B), and (D) are presented as mean ± SEM. Data in (C) and (E) are presented as violin plots overlaid with individual data points. For each group and timepoint, the following numbers of mice were used: (A): male AL, n=42 (Wk 0), 36 (Wk2, Wk 2), 34 (Wk 3), 29 (Wk 4), 26 (Wk 5), or 22 (Wk 6); female AL, n=43 (Wk 0), 28 (Wk 1), 35 (Wk 2), 31 (Wk 3), 27 (Wk 4), 26 (Wk 5), or 21 (Wk 6); male CR, n=44 (Wk 0), 40 (Wk 1), 38 (Wk 2), 35 (Wk 3), 31 (Wk 4), 29 (Wk 5), or 26 (Wk 6); female CR, n=51 (Wk 0), 44 (Wk 1, Wk 2), 41 (Wk 4), 35 (Wk 4), 33 (Wk 5), or 27 (Wk 6). (B): male AL, n=27 (T0, T15, T30, T60, T120); female AL, n=26 (T15, T30, T120), or 25 (T0, T60); male CR, n=27 (T0, T15, T30, T60, T120); female CR, n=28 (T0, T15, T30, T60, T120). (C): male AL, n=27; female AL, n=26; male CR, n=27; female CR, n=28. (D): male AL, n=9 (T0, T15, T30, T60, T120); female AL, n=11 (T0, T15), 10 (T30, T60), or 8 (T120); male CR, n=17 (T0), 16 (T30), 15 (T60), 13 (T15), or 11 (T120); female CR, n=11 (T15, T30, T60,), or 10 (T0, T120). (E): male AL, n=9; female AL, n=9; male CR, n=16; female CR, n=9. In (A), (B), and (D), significant effects of diet, sex and/or time, and interactions thereof, were determined using a mixed-effects model. In (C) and (E), significant effects of sex, diet, and sex-diet interaction for tAUC, iAUC, HOMA-IR, and Matsuda Index were assessed using two-way ANOVA with Tukey’s multiple comparisons test. Overall p values for each variable, and their interactions, are shown with each graph. For (C) and (E), statistically significant differences between comparable groups are indicated by *** (p<0.001) or with p values shown. Source data are provided as a Source Data file. See also Figure 4—figure supplement 1.


