. 2023 Apr 25;12:e88080. doi: 10.7554/eLife.88080

Figure 5. The effects of CR on glucose uptake do not differ between male and female mice.

Male and female C57BL6/NCrl mice were fed AL or CR diet from 9 to 15 weeks of age, as described for Figure 2. At 15 weeks of age, glucose uptake was assessed by PET/CT with 18F-fluorodeoxyglucose (18F-FDG). (A–C) 18F-FDG uptake in the indicated tissues was determined as SUVs from PET/CT scans (A) or as % injected dose per gram of tissue (%ID/g) from gamma counting of dissected whole tissues (C). (B) PET/CT images confirm that 18F-FDG uptake in interscapular BAT is greater in females than in males, regardless of diet. Data are shown as violin plots (A,C) or representative images (B) of 7 (male AL, female AL, male CR) or 6 (female CR) mice per group. For each tissue in (A) and (C), significant effects of sex, diet, and sex-diet interaction were assessed by two-way ANOVA; overall p values for each variable, and their interactions, are shown beneath each graph. Significant differences between each group, as determined using Tukey’s multiple comparisons test, are indicated by * (p<0.05). Source data are provided as a Source Data file. See also Figure 5—figure supplement 1.

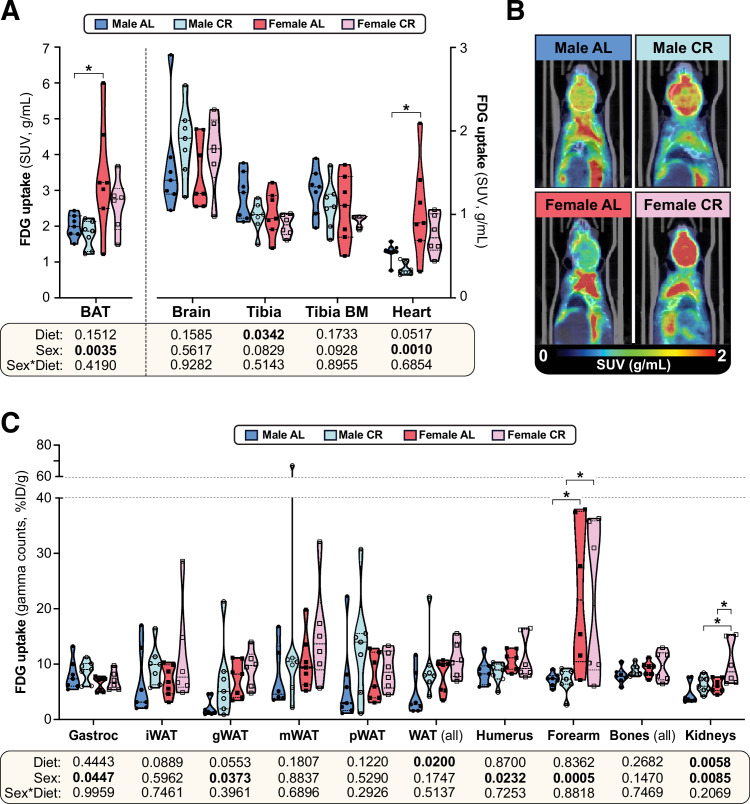
Figure 5—source data 1. The effects of CR on glucose uptake do not differ between male and female mice.
Values for the data presented in Figure 5A and C are shown in the file named ‘Figure 5_Source_Data.xlsx’.

Figure 5.

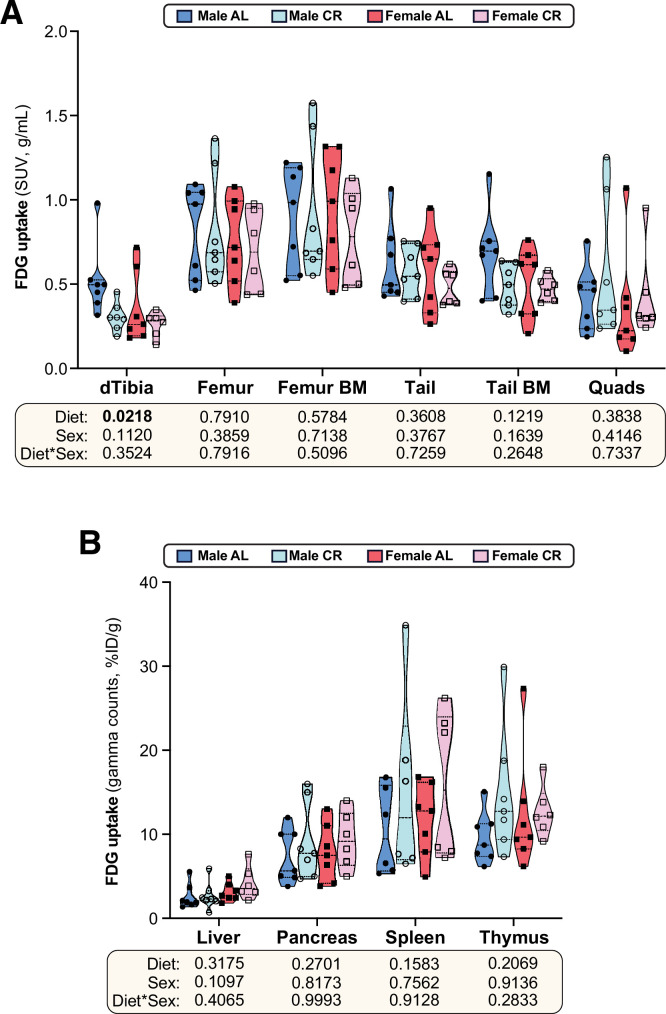
Figure 5—figure supplement 1. The effects of CR on glucose uptake in peripheral tissues.

Figure 5—figure supplement 1.

Male and female C57BL6/NCrl mice were fed AL or CR diet and glucose uptake was assessed by 18F-FDG PET/CT, as described for Figure 5. (A,B)18F-FDG uptake in the indicated tissues was determined by PMOD analysis of PET/CT scans (A) or gamma counting of dissected whole tissues (B). Data in (A) and (B) are presented as truncated violin plots, overlaid with individual data points, from 7 (male AL, female AL, male CR) or 6 (female CR) mice per group; in (B), data for spleen are from 6 mice per group only. Statistical significance was determined as described for Figure 5. Source data are provided as a Source Data file.
Figure 5—figure supplement 1—source data 1. The effects of CR on glucose uptake in peripheral tissues.
Values for the data presented in Figure 5—figure supplement 1A–B are shown in the file named ‘Figure 5-figure supplement 1_Source_Data.xlsx’.