. 2023 Apr 25;12:e88080. doi: 10.7554/eLife.88080

Figure 6. CR exerts sexually dimorphic effects on hepatic sphingolipid content.

Male and female C57BL6/NCrl mice were fed AL or CR diet from 9 to 15 weeks of age, as described for Figure 2. Livers were sampled at necropsy (15 weeks) and used to assess triglyceride, ceramide, and dihydroceramide. (A) Hepatic triglyceride content. (B,C) LC-MS analysis of total, 22:0 and 23:0 ceramides (B), dihydroceramides (C, left side) and the ceramide:DHC ratio (C, right side). (D) Principal component analysis of ceramide and dihydroceramide content based on data in (B–C) and Figure 6—figure supplement 1. PC1, PC2, and PC3 account for 47.4%, 14.1%, and 10.5% of the variance, respectively. Data in (A), (B), and (C) are presented as truncated violin plots overlaid with individual data points. Data represent the following numbers of mice per group. (A): male AL, n=9; female AL, n=8; male CR, n=9; female CR, n=8. (B–D): 6 mice per group. For (A), (B), and (C), significant effects of sex, diet, and sex-diet interaction were assessed using two-way ANOVA; overall p values for each variable, and their interactions, are shown beneath each graph. Significant differences between comparable groups were assess using Tukey’s multiple comparison test and are indicated by * (p<0.05), ** (p<0.01), or *** (p<0.001). Source data are provided as a Source Data file. See also Figure 6—figure supplement 1.

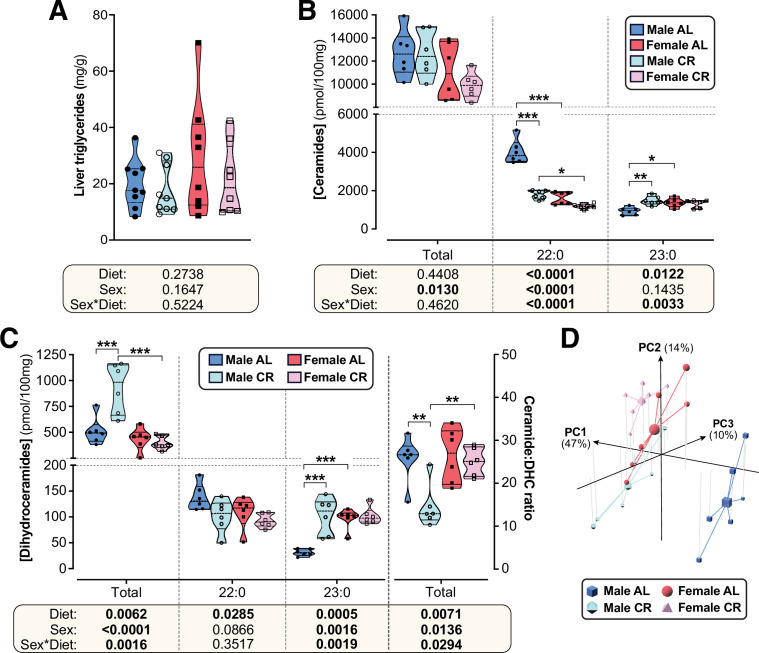
Figure 6—source data 1. CR exerts sexually dimorphic effects on hepatic sphingolipid content.
Values for the data presented in Figure 6A–D are shown in the file named ‘Figure 6_Source_Data.xlsx’. The code used for Principal Component Analysis in Figure 6D is in the file named ‘R code for Principal Component Analysis from ceramide data.r’.

Figure 6.

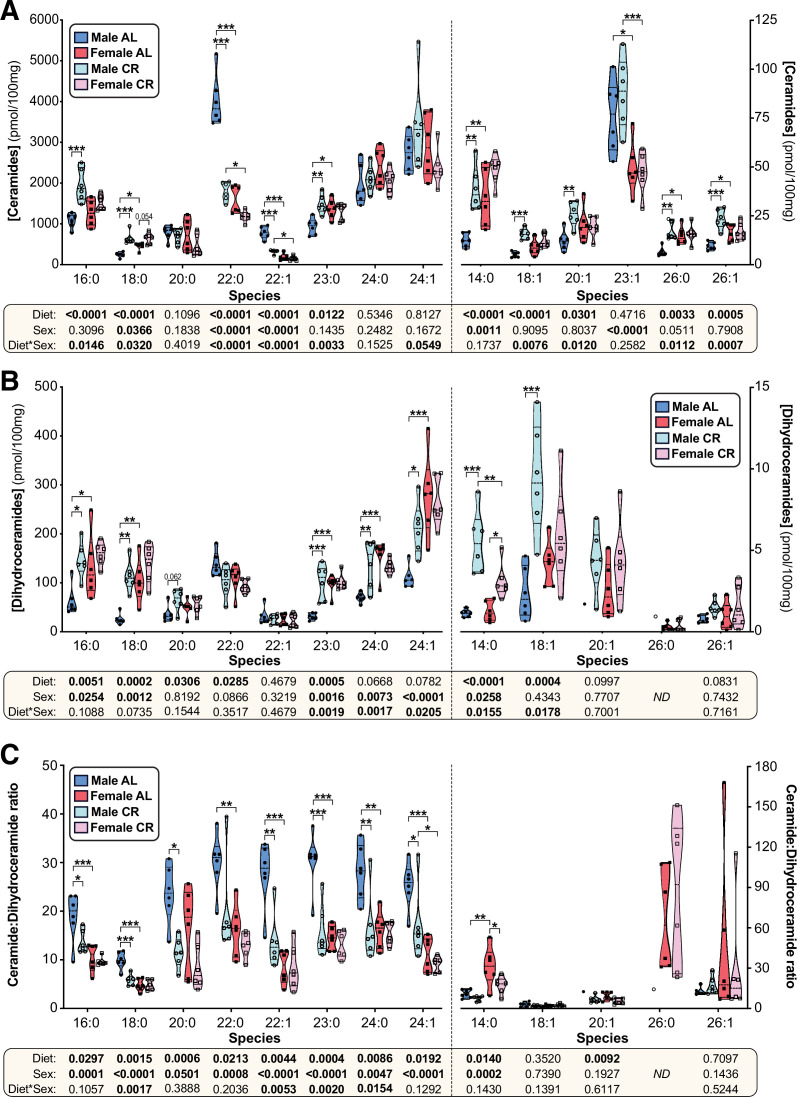
Figure 6—figure supplement 1. CR exerts sexually dimorphic effects on hepatic sphingolipid content.

Figure 6—figure supplement 1.

Male and female mice were fed AL or CR diets as described for Figure 2. (A–C) At necropsy, livers were sampled for analysis of ceramide and dihydroceramide content by LC-MS. Data show the concentration of each species of ceramide (A), dihydroceramide (B), or dihydroceramide:ceramide ratio (C) and are presented as truncated violin plots showing all points. The following numbers of mice were used per group and species: male AL, n=6 (all except: DHC 20:1 & 26:0, Cer:DHC 20:1 & 26:0), 1 (DHC & Cer:DHC 20:1), or 0 (DHC & Cer:DHC 26:0); female AL, n=6; male CR, n=6 (all except DHC & Cer:DHC 26:0), or 1 (DHC & Cer:DHC 26:0); female CR, n=6. For each species, significant effects of sex, diet, and sex-diet interaction were assessed using two-way ANOVA; overall p values for each variable, and their interactions, are shown beneath each graph. Significant differences between comparable groups were assess using Tukey’s multiple comparison test and are indicated by * (p<0.05), ** (p<0.01), or *** (p<0.001). Source data are provided as a Source Data file.
Figure 6—figure supplement 1—source data 1. CR exerts sexually dimorphic effects on hepatic sphingolipid content.
Values for the data presented in Figure 6—figure supplement 1A–C are shown in the file named “Figure 6-figure supplement 1_Source_Data.xlsx”.