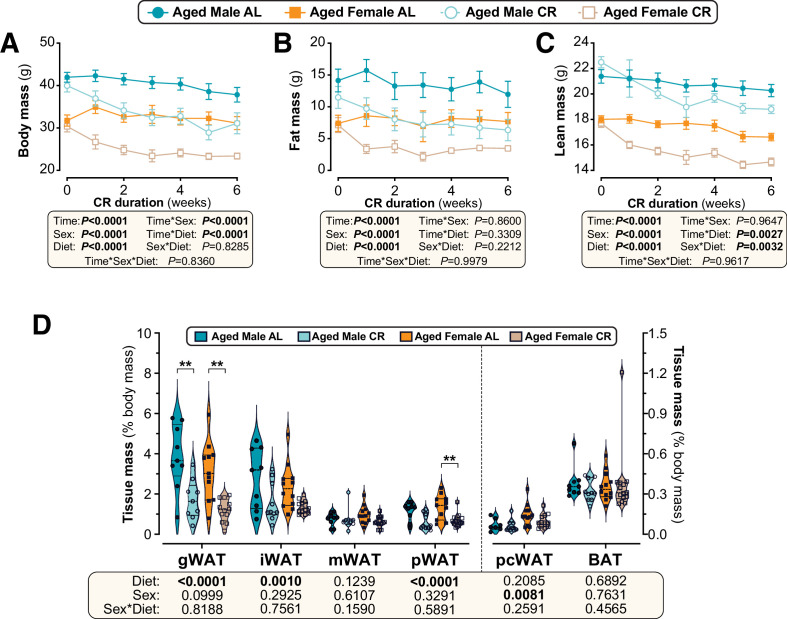
Figure 8. Sex differences in CR-induced weight loss and fat loss are absent when CR is initiated in aged mice.
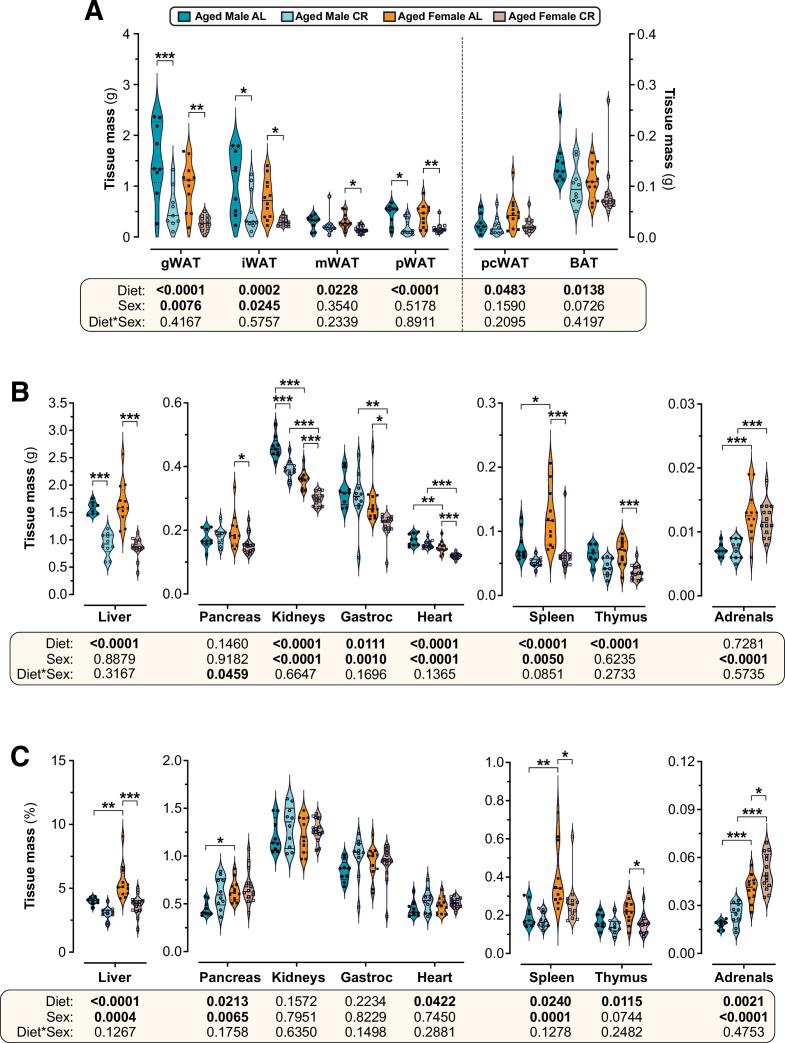
Male and female C57BL6/NCrl mice were single housed and fed AL or a CR diet (70% of daily AL intake) from 78 to 84 weeks of age. (A–F) Each week mice were weighed (A,B) and body composition was determined by TD-NMR (C–F). Body mass, fat mass and lean mass are shown as absolute masses (A,C,E) or fold-change relative to baseline (B,D,F). (G) Masses of gWAT, iWAT, mWAT, pWAT, pcWAT, and BAT were recorded at necropsy and are shown as % body mass. Data in (A–F) are shown as mean ± SEM. Data in (G) are shown as violin plots overlaid with individual data points. For each group and timepoint, the following numbers of mice were used: (A,B): male AL, n=9 (Wk 0, Wk 2, Wk3, Wk 4), 8 (Wk 1), or 6 (Wk 5, Wk 6); female AL, n=13 (Wk 0, Wk 2), 12 (Wk 4, Wk 5), 11 (Wk 6), 9 (Wk 1), or 8 (Wk 3); male CR, n=10 (Wk 0, Wk 2–4), 9 (Wk 1), 7 (Wk 5), or 6 (Wk 6); female CR, n=14 (Wk 0, Wk 4, Wk 5), 13 (Wk 2, Wk 6), 10 (Wk 3), or 9 (Wk 1). (C–F): male AL, n=9 (Wk 0, Wk 2), 8 (Wk 3, Wk 4, Wk 6), or 7 (Wk 1, Wk 5); female AL, n=13 (Wk 0, Wk 2), 9 (Wk 4, Wk 6), 8 (Wk 5), 6 (Wk 1), or 5 (Wk 3); male CR, n=10 (Wk 0, Wk 2), 9 (Wk3-6), or 8 (Wk 1); female CR, n=14 (Wk 1, Wk 2), 11 (Wk 4–6), 7 (Wk 3), or 6 (Wk 1). (G): male AL, n=9; female AL, n=12 (iWAT, mWAT) or 11 (gWAT, pWAT); male CR, n=10 (iWAT, pWAT), or 9 (gWAT, mWAT); female CR, n=14 (mWAT, pWAT), 13 (iWAT), or 12 (gWAT). For (A–F), significant effects of diet, sex and/or time, and interactions thereof, were determined by three-way ANOVA or a mixed-effects model. For (G), significant effects of sex, diet, and sex-diet interaction were assessed using two-way ANOVA with Tukey’s multiple comparisons test. Overall p values for each variable, and their interactions, are shown beneath each graph. For (G), significant differences between comparable groups are indicated by ** (p<0.01) or *** (p<0.001). Source data are provided as a Source Data file. See also Figure 8—figure supplement 1.


