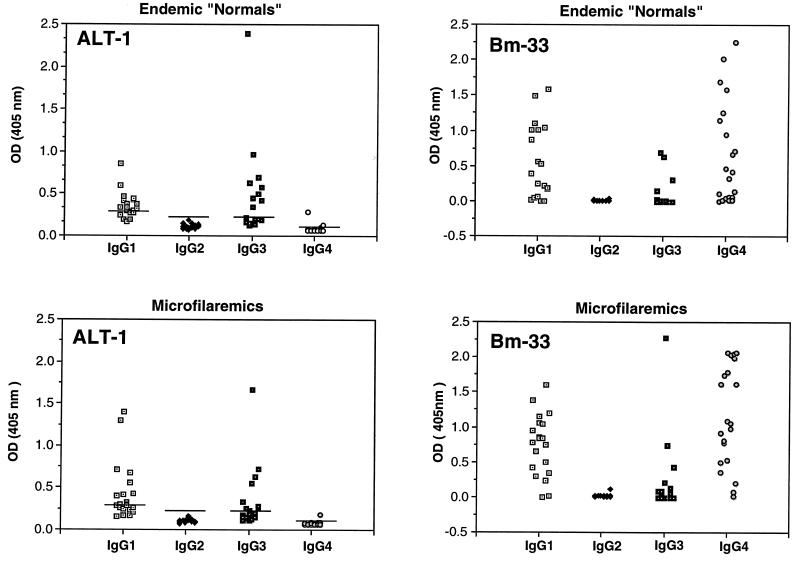
FIG. 4.
ELISA using 40 human B. malayi filariasis sera against ALT-1 and Bm-33 proteins. Upper panels show sera from amicrofilaremic normal subjects where filariasis is endemic; lower panels show sera from patients with circulating microfilariae. Horizontal bars in ALT-1 panels represent the mean value + 3 standard deviations of nonendemic control human serum reactions. Values for Bm-33 represent the net optical density (OD) following subtraction of readings for each serum against its fusion protein partner, MBP.

