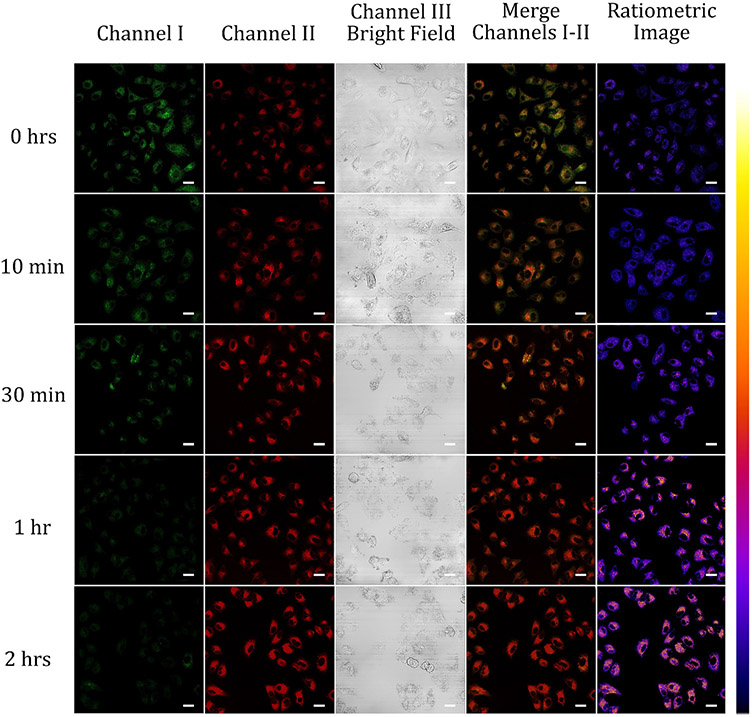
Fig. 7.
Fluorescence imaging of A549 cells including 10 μM of probe A in serum-free medium for different periods. The green channel I was used to collect the probe’s visible fluorescence from 500 nm to 550 nm while red channel II was utilized to obtain the probe’s near-infrared fluorescence from 625 nm to 675 of probe A at 488 nm excitation. Scale bars of all images above are at 50 μm.

