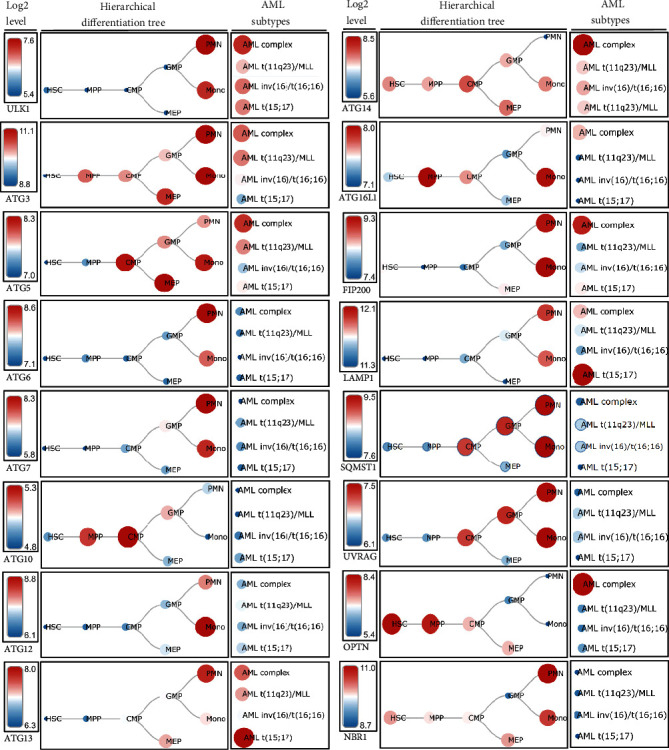
Figure 4.

Expression of different autophagy markers in hematopoietic cells and AMLs. Schematic representation indicated the expression level of different ATG genes, autophagy-related factors, and different ATG receptors in both hematopoietic cells and various types of acute myeloid leukemia. PMN: polymorphonuclear cells; MPP: multipotential progenitors; MLL: mixed-lineage leukemia; AML t(15;17): AML with t(15;17); AML inv(16)/t(16;16): AML with inv(16)/t(16;16); AML t(11q23)/MLL: AML with t(11q23)/MLL; AML complex: AML with complex aberrant karyotype. Data were generated from normal human samples and samples from the human AML cells using microarray-based gene expression profiling. The “BloodSpot” (https://servers.binf.ku.dk/bloodspot/) database was used to generate the hierarchical differentiation tree.
