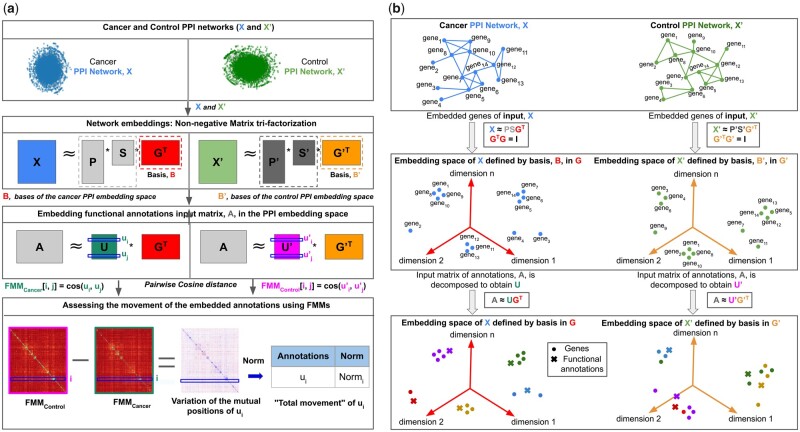
Figure 1.
(a) Illustration of our new FMM-based method. For a pair of cancer and control tissues, we construct their tissue-specific PPI interaction networks as explained in Section 2.1 (in green and blue for cancer and control, respectively). These networks, represented by their PPMI matrices, X and , are decomposed as the products of three factors: P, S, and GT for cancer, and , and for control, where the set of all rows of GT and defines the basis B and , respectively (illustrated in the second panel from the top). From these matrix factors, we use the bases matrix of the resulting NMTF-based embedding spaces, GT and , to generate the matrices U and , whose ith row are the embedding vectors ui of annotation ai in the cancer and control embedding spaces defined by the bases, B and , respectively (illustrated in the third panel from the top). We capture the distances (cosine distances) between the embedding vectors of all pairs of annotations, in each cancer and control embedding space, by computing FMMs as defined in Section 2.4 and illustrated at the ‘Pairwise Cosine distance’ line between the two panels at the bottom of the figure. Then, we subtract the cancer and control FMM matrices, FMMControl—FMMCancer, to detect the changes in mutual positions of the embedding vectors ui of each annotation ai between cancer and control embedding spaces. Finally, to have the score of ‘movement’ for ui (illustrated in Section 2.7), we apply the Euclidean norm to the rows of the matrix identified as ‘Variation of the mutual positions of ui’ in the bottom panel of the figure. (b) Toy example of our new FMM-based method: the first panel shows a toy example of cancer and control PPI networks. The second panel shows a 3D illustration of the embedding spaces of the toy example of cancer and control networks generated by our NMTF framework. The third panel shows the embedding vectors of the biological functions in the aforementioned cancer and control embedding spaces. Colors in the third panel represent the biological functions of the genes.

