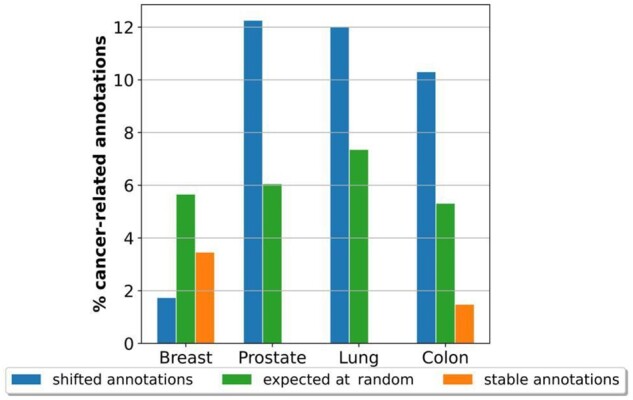
Figure 2.

‘Movement’ in the embedding space is related to cancer. The panel contains the percentages of enriched cancer-related GO BP terms out of all GO BP terms (vertical axis) in the ‘shifted’ annotations set (in blue), ‘stable’ annotations set (in orange), and the expected by random (in green), for each cancer type (on the horizontal axis).
