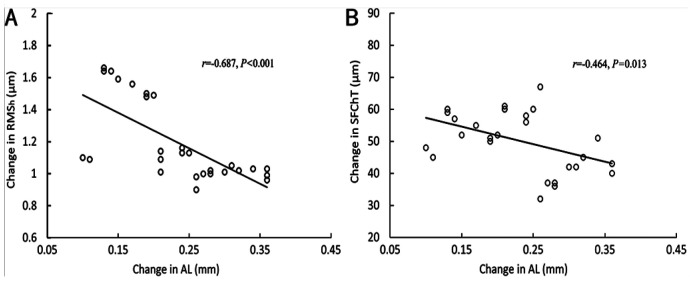
Figure 4. Scatterplots exhibit the correlation between the change in RMSh (A), SFChT (B) and the change in AL in the M-ICF group over 2y.
Regression lines indicate the coefficients of the Pearson correlation in the M-ICF group. AL: Axial length; RMSh: Higher-order aberrations expressed as root mean square; SFChT: Subfoveal choroidal thickness.

