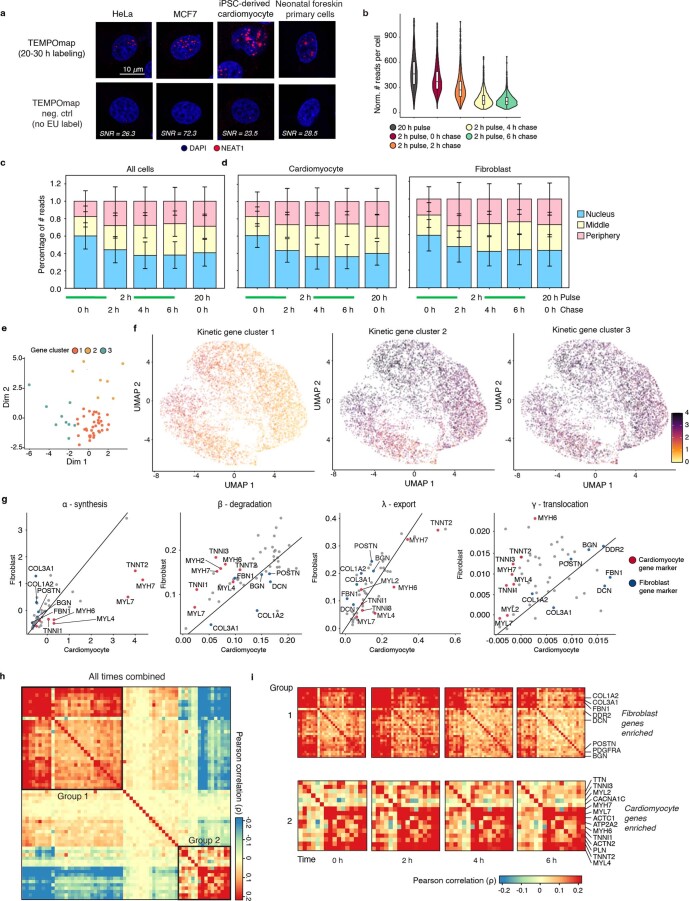
Extended Data Fig. 9. RNA subcellular dynamics in hiPSC-CMs.
a, Representative fluorescent cell images of TEMPOmap detection of NEAT1 in HeLa cells, MCF7, iPSC culture and primary foreskin cells. SNR (TEMPOmap 20-30 h labeling condition/No EU controls) in each cell line is shown in the images (n = 4-6 images). Scale bar: 10 μm. b, RNA reads (cDNA amplicons) per cell for each pulse-chase timepoint in hiPSC-CMs culture. c-d, stacked bar plots summarizing the fraction of reads in each subcellular region of all cells at each timepoint when combining all cells (c) and separating into CMs and cardiac fibroblasts (d). Vertical lines indicate s.d. e, PCA representation showing the gene clustering of 64 genes using all eight estimated parameters across cell cycle. f, UMAP visualization of single cells showing the averaged expression level of each gene in cluster 1-3 across all timepoints. Color indicates the level of averaged RNA expression. g, scatter plots showing the correlation of α, β, λ, γ (from left to right) in CMs and cardiac fibroblasts. Marker genes for CMs are colored in red, and for cardiac fibroblasts in blue. Units of α is RNA concentration/hr, where RNA concentration is defined by copies/voxel (voxel = 90 nm x 90 nm x 350 nm). Units of β, λ, γ are hr−1. h-i, Heatmap depicting the pairwise correlation of 64 genes in the hiPSC-CMs by TEMPOmap-measured single-cell RNA covariation when combining four chase timepoints (0, 2, 4, 6 hrs chase), where the color indicates the value of Pearson correlation (h). Group 1-2 are highlighted for highly correlated gene modules (left) and zoomed in (i).

