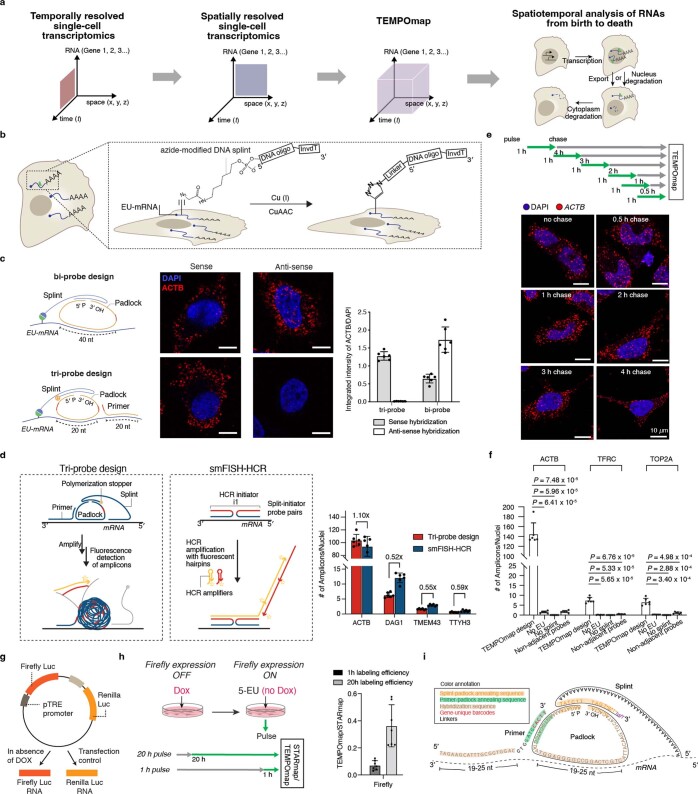
Extended Data Fig. 1. TEMPOmap experimental design and optimization.
a, Method conceptualization. TEMPOmap combines RNA metabolic labeling and state-of-the-art spatial transcriptomics to achieve single-cell spatiotemporal transcriptomics for RNA dynamic analysis. b, CuAAC-mediated click chemistry to conjugate azide-modified splint and EU-labeled nascent transcript. c, Comparison of TEMPOmap bi-probe and tri-probe design targeting ACTB mRNA. Left, probe design schematics. Middle, representative fluorescent images of cells treated with sense-targeting and antisense-targeting padlocks and primers. Right, quantification of fluorescence in cell images (6 images containing 400-600 cells were measured under each condition). Data shown as mean + s.d. d, left: schematics showing the probe design and experiment of tri-probe and smFISH-HCR. Tri-probe consists of three probes (primer, padlock, and splint) that target the same region of RNA targets, where the circularized padlock will be amplified to generate amplicons when all three probes are hybridizing on the same RNA locus. smFISH-HCR probe sets target to the same RNA regions, and bound probe pairs trigger self-assembly of a tethered fluorescent amplification polymer (or amplicon); right: quantification of the averaged number of amplicons per cell generated from tri-probe design or smFISH-HCR when targeting four genes with different expression levels (ACTB, DAG1, TMEM43, TTYH3) (n = 6 images per condition). e, Proof-of-concept pulse-chase experiment (top) followed by raw cell images (bottom) showing the translocation of ACTB mRNAs when chased after 1 hr EU treatment with different times. Cell nuclei (blue), amplicons (red). f, quantification of the averaged amplicon reads per cell (n = 6 images for each experimental condition). Unpaired two-sided t-test. g, schematics showing the mechanism of action of DNA vector expressing Firefly luciferase (under the control of DOX-induced promoter) and Renilla luciferase (under the control of constitutive promoter). h, left: schematics showing the two EU pulse-labeling timepoints while inducing the expression of Firefly luciferase for the same duration of time, followed by TEMPOmap/STARmap experiment; right: the quantification of the ratios of the average amplicon counts by TEMPOmap over STARmap for each field of view (n = 7 images). i, DNA sequences of TEMPOmap tri-probe system. Data shown as mean + s.d. Scale bar: 10 µm.

