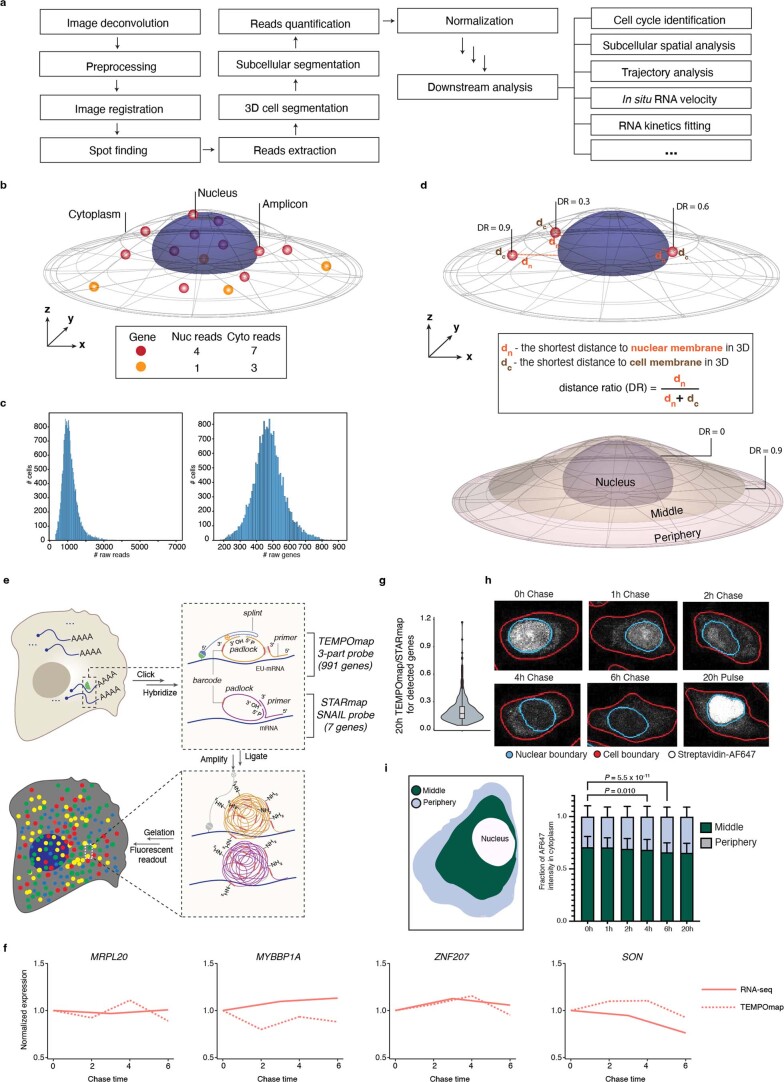
Extended Data Fig. 2. TEMPOmap data processing and analysis.
a, TEMPOmap data analysis pipeline. b, Schematics of reads assignment in subcellular compartments. c, Histograms showing detected reads (cDNA amplicons) per cell (left), and genes per cell (right). d, Schematics of distance ratio (DR)-based subcellular segmentation in the cytoplasm. Two values for each amplicon were computed in 3D: dn, the shortest distance to nuclear membrane; dc, the shortest distance to cell membrane. ‘Middle’ is the region defined between DR = 0 and 0.9. ‘Periphery’ is defined as DR > 0.9. e, Simultaneous mapping and sequencing of nascent RNAs by TEMPOmap and total RNAs by STARmap in the experimental workflow. TEMPOmap-targeted amplicon reads were normalized against the reads of STARmap-targeted RNAs. f, validation of normalization strategy by comparing the gene expression data of example RNAs between TEMPOmap and bulk RNA-seq34. Both datasets were normalized by the first timepoint to facilitate the comparison of change in gene expression. g, violin plot showing the distribution of the ratios of TEMPOmap reads over STARmap reads averaged across single cells for all detected genes (n = 991 genes). Boxplots are defined in terms of mean (center line), 25-75% percentile (bounds of box), lower and upper quartile (whiskers) and outlier values (dots). h, representative fluorescent images showing the subcellular distribution of streptavidin fluorescence across pulse-chase labeling times. i, left: subcellular region assignment (middle and periphery) of one representative cell; right: boxplot summarizing the fraction of reads in two subcellular regions of single cells at each timepoint. Data are presented as mean values + /- s.d. The statistics compare the fractions of reads in the periphery. Kruskal–Wallis test with post hoc Tukey’s HSD. n = 238, 310, 171, 314, 333, 286 cells in each timepoint from left to right.

