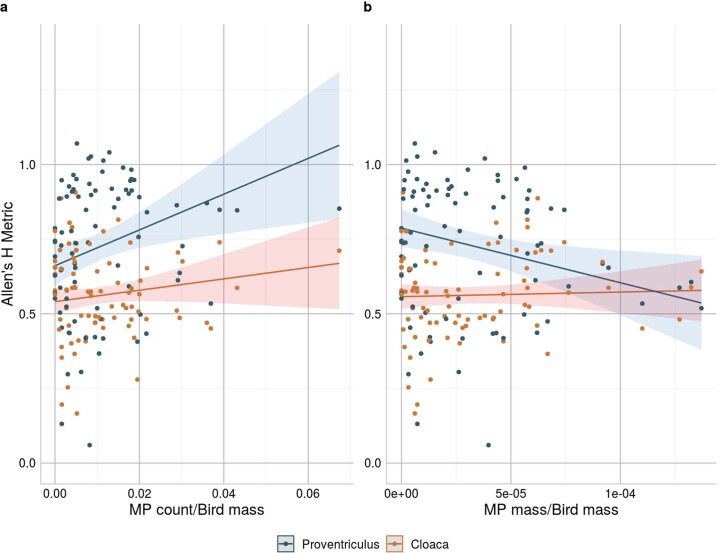
Extended Data Fig. 3. Correlations between microplastics (MP) and the alpha diversity of the proventricular and cloacal microbiomes in northern fulmar and Cory’s shearwater individuals.
Each dot represents a microbiome sample that is colored by the location within the GIT, either from the proventricular (blue dots, n = 85) or cloacal microbiome (orange dots, n = 84). Alpha diversity metric Allen’s H metric is plotted in relation to a the proportion of MP counts (MP count/individual bird mass) and b the proportion of MP mass (MP mass/individual bird mass). The lines in each plot denote the predicted values based on the linear mixed model for the alpha diversity metric and the shaded areas flanking the lines indicate the upper and lower 95% confidence intervals.

