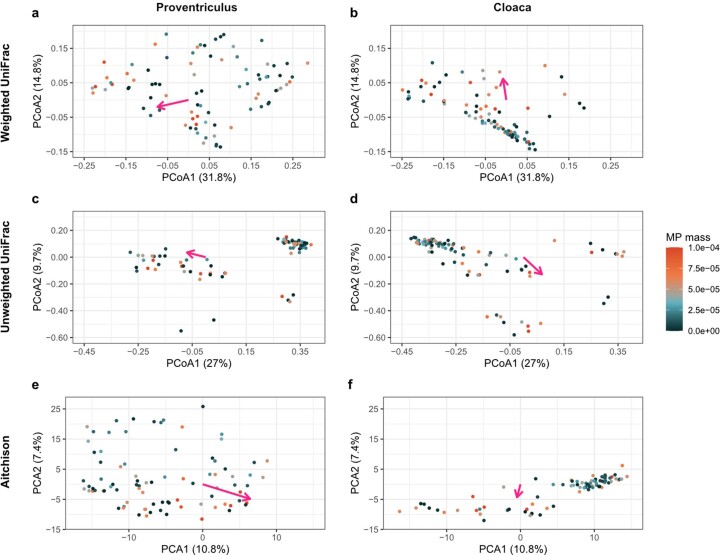
Extended Data Fig. 7. Ordination plots showing the correlations between MP mass and seabird proventricular versus cloacal microbial beta diversity.
PCoA plots with a,b weighted UniFrac distances, c,d unweighted UniFrac distances, and e,f PCA plots with Euclidean distances (Aitchison’s approach) illustrate the effects of MP mass on seabird proventricular (a,c,e; n = 85) versus cloacal (b,d,f; n = 84) microbial beta diversity. Each dot represents a microbiome sample colored on a continuous scale by the proportion of MP mass (MP mass/individual bird mass) and magenta arrows show the direction of the MP effects.

