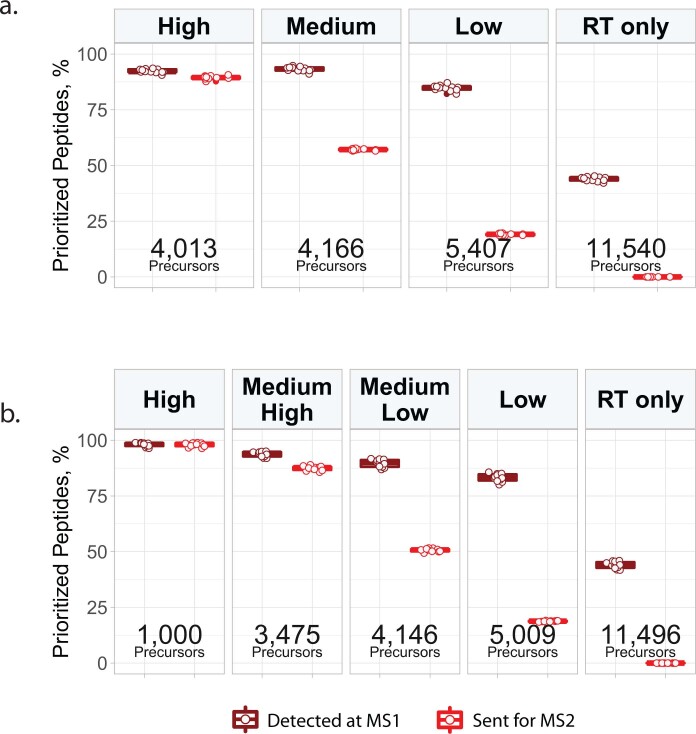
Extended Data Fig. 4. Fraction of inclusion-list precursors detected and analyzed in pSCoPE runs.
(a) MS1 detection and MS2 analysis rates for prioritized precursors in the benchmark experiments displayed in Fig. 2a. Each boxplot contains 8 data points, one for each LC-MS/MS analysis. (b) MS1 detection and MS2 analysis rates for prioritized precursors in the benchmark experiments displayed in Fig. 2b–e. Each boxplot contains 8 data points, one for each LC-MS/MS analysis. In both panels, the statistics are shown for each tier along with the number of precursors in the tier. Boxplot whiskers display the minimum and maximum values within 1.5 times the interquartile range of the 25th and 75th percentiles, respectively; the 25th percentile, median, and 75th percentile are also featured.

