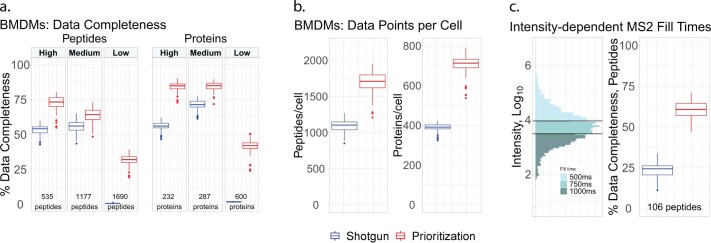
Extended Data Fig. 6. Data completeness and proteome coverage for BMDMs analyzed by shotgun or prioritized methods.
(a) Percent data completeness tallied for peptides and proteins quantified across twenty shotgun and twenty pSCoPE experiments, faceted by priority tier. n = 175 and 186 single-cells for the prioritized and shotgun analysis methods, respectively. (b) Number of peptides and proteins per single-cell sample across twenty shotgun and twenty pSCoPE experiments. n = 175 and 186 single-cells for the prioritized and shotgun analysis methods, respectively. (c) Illustration of precursor-intensity-dependent MS2 fill times for precursors on the top priority tier. Percent data completeness contrast for precursors which were allotted increased fill times in the pSCoPE analyses. n = 175 and 186 single-cells for the prioritized and shotgun analysis methods, respectively. Boxplot whiskers display the minimum and maximum values within 1.5 times the interquartile range of the 25th and 75th percentiles, respectively; the 25th percentile, median, and 75th percentile are also featured.

