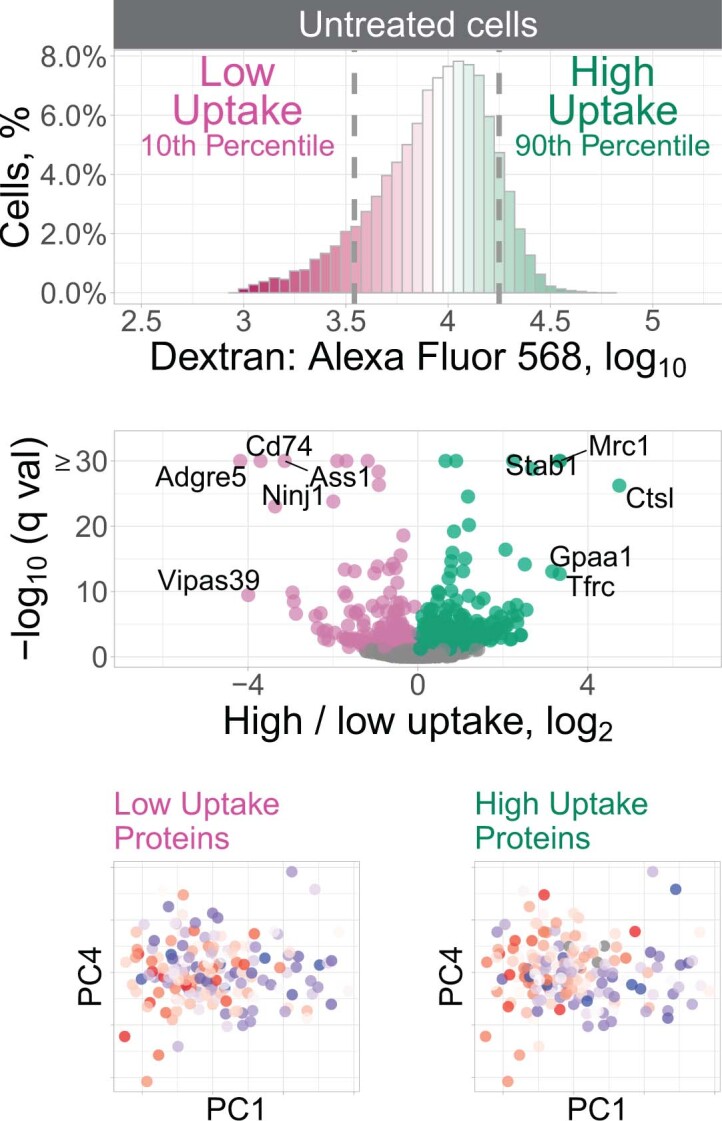
Extended Data Fig. 10. Dextran uptake in untreated BMDM samples.

The uptake of fluorescent dextran by the untreated macrophages was measured by FACS, and the cells with the lowest and highest uptake were isolated for protein analysis. The volcano plot displays the fold changes for differentially abundant proteins and the associated statistical significance. The untreated macrophages were displayed in the space of their PCs and color-coded by the median abundance of the low-uptake or the high-uptake proteins. Both the low and the high-uptake proteins correlate inversely to PC1 (low-uptake: Spearman r = −0.29, q <= 6×10⁻⁴; high-uptake: Spearman r = −0.37, q <= 4×10⁻⁶).
