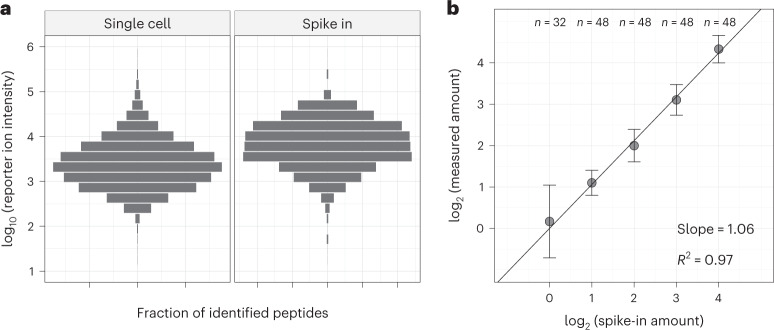
Fig. 3. Evaluating quantitative accuracy and precision of pSCoPE with peptide standards.
a, Reporter ion intensities for precursors identified at 1% FDR from single cells and from the spike-in peptides, which were dispensed into the single-cell samples across a 16-fold range. b, Normalized reporter ion intensities for all tryptic products from the spike-in peptides plotted against their spike-in amounts, with regression slope and goodness of fit displayed. Points denote the median, and error bars denote s.d. of the distribution of normalized reporter ion intensities for each spike-in level. The data in a and b come from eight prioritized experiments, and the numbers of data points for each of the spike-in levels are indicated on the top. The experimental design for this set of analyses can be found in Supplementary Table 1.

