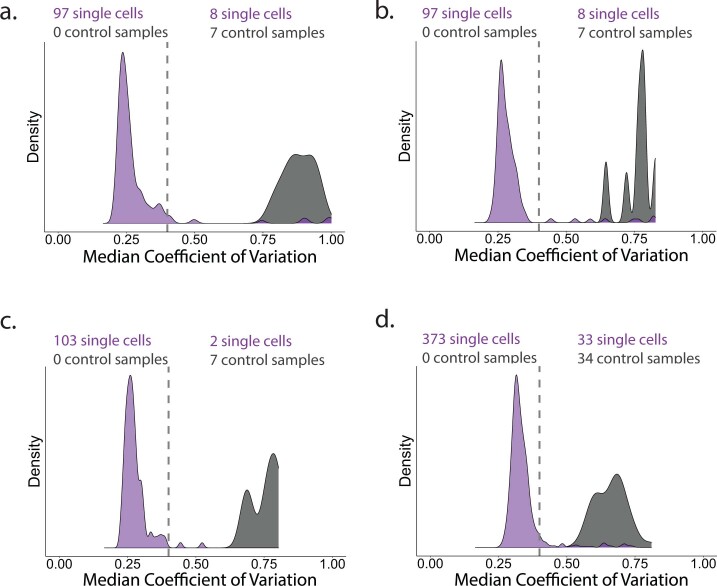
Extended Data Fig. 2. Single-cell quality controls.
The median coefficient of variation (that is the standard deviation scaled by the mean) of all peptide-level relative abundances that map to the same leading razor protein is used to separate successfully prepared single cells from those that will not generate accurate data. By choosing a CV threshold that separates control samples (droplets which received all reagents but did not contain a single cell) from single cells, cells with noisier protein-level quantitation can be removed prior to further data processing. The single-cell and control tallies above each figure represent the number of single cells or control wells that passed the CV threshold of 0.4. (a) contains the CV distributions for the single-cell samples associated with Fig. 2a–e, analyzed by shotgun LC-MS/MS methods. (b) contains the CV distributions for the single-cell samples associated with Fig. 2a, analyzed by pSCoPE. (c) contains the CV distributions for the single-cell samples associated with Fig. 2b–e, analyzed by pSCoPE. (d) contains the CV distributions for the single-cell samples associated with Figs. 4–6.

