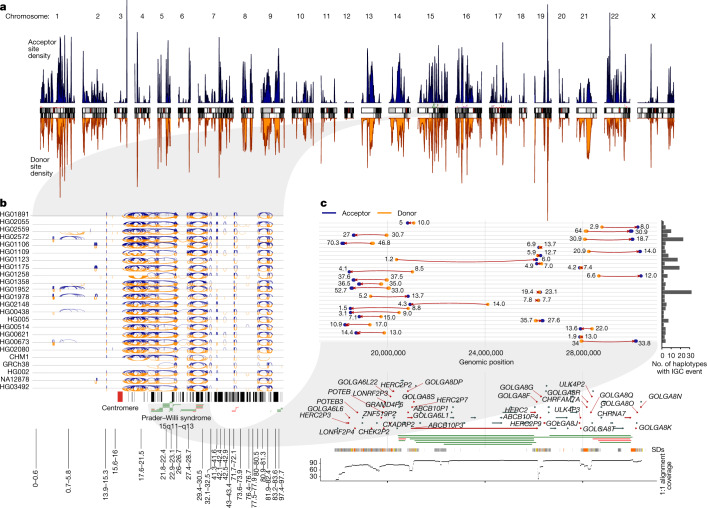
Fig. 3. IGC hotspots.
a, Density of IGC acceptor (top, blue) and donor (bottom, orange) sites across the ‘SD genome’. The SD genome consists of all main SD regions (>50 kbp) minus the intervening unique sequences. b, All intrachromosomal IGC events on 24 human haplotypes analysed for chromosome 15. Arcs drawn in blue (top) have the acceptor site on the left-hand side and the donor site on the right. Arcs drawn in orange (bottom) are arranged oppositely. Protein-coding genes are drawn as vertical black lines above the ideogram, and large duplication (blue) and deletion (red) events associated with human diseases are drawn as horizontal lines just above the ideogram. c, Zoom of the 30 highest confidence (lowest P value) IGC events on chromosome 15 between 17 and 31 Mbp. The number to the left of each event shows its length (kbp) and that to the right shows its number of SNVs. Genes with IGC events are highlighted in red and associate with the breakpoint regions of Prader–Willi syndrome. An expanded graphic with all haplotypes is included in Extended Data Fig. 7.

