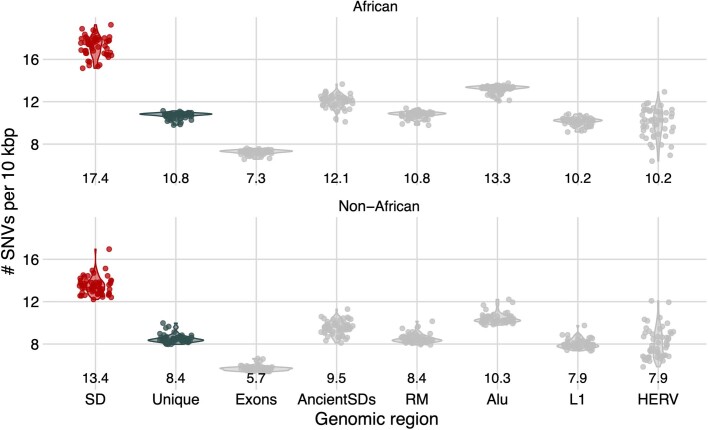
Extended Data Fig. 4. Average number of SNVs across different repeat classes.
Shown are the average number of SNVs per 10 kbp within SDs (red), unique (blue), and additional sequence classes (gray) across the HPRC haplotypes. These classes include exonic regions, ancient SDs (SD with <90% sequence identity) and all elements identified by RepeatMasker (RM) with Alu, L1 LINE, and HERV elements broken out separately. Below each sequence class we show the average number of SNVs per 10 kbp for the median haplotype. Standard deviations and measurements for additional repeat classes are provided in Table S3.

