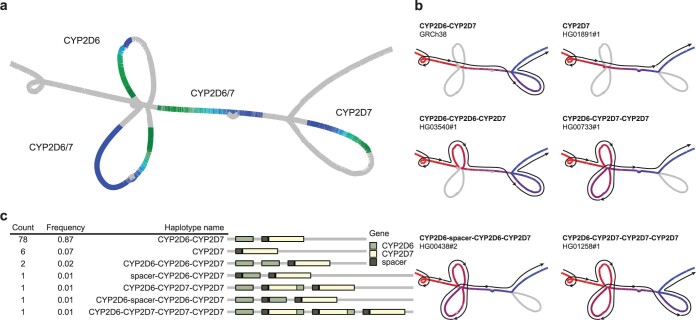
Extended Data Fig. 6. Structural haplotypes of CYP2D6 and CYP2D7 from the MC graph.
a, Locations of CYP2D6 and CYP2D7 within the graph. The colour gradient is based on the precise relative position of each gene; green, head of a gene; blue, end of a gene. b, Different structural haplotypes take different paths through the graph. The colour gradient and lines show the path of each allele; red, start of a path; blue, end of a path. c, Frequency and linear structural visualization of all structural haplotypes called by the graph among 90 haploid assemblies.

