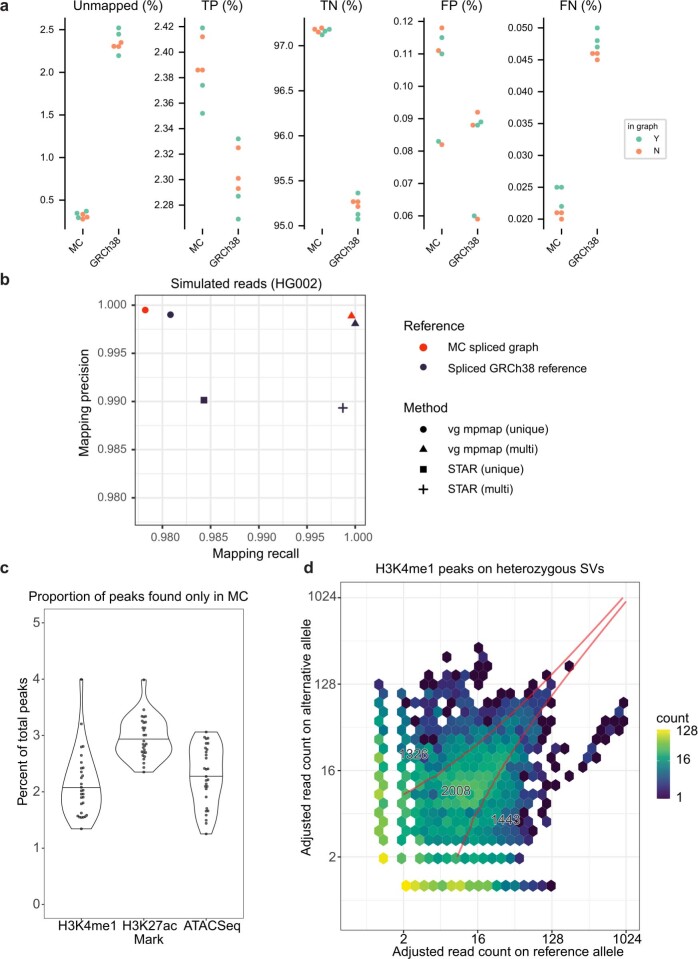
Extended Data Fig. 10. Additional applications supported by the pangenome reference.
a, Performance of read alignment in VNTR regions using the MC graph versus GRCh38. All statistics are expressed relative to the total number of reads simulated from each genome. b, Performance of RNA-seq read alignment. Mapping rate and false discovery rate are stratified by mapping quality producing the curves shown. The MC graph is compared to a graph derived from the 1KG variant calls and to GRCh38. Each reference is augmented with splice junctions. vg mpmap was used to map to the graphs, and STAR was used to map to the linear reference. c, Proportion of all ChIP-seq peaks that are called only in the MC graph. Each data point represents samples that were assayed for H3K4me1, H3K27ac histone marks or chromatin accessibility using ATAC-seq. d, H3K4me1 peaks that overlap an SV for which the sample is heterozygous. The reads within the peak are partitioned between the SV or reference allele. The red boundary represents regions where a binomial test assigns a peak to the SV allele, both alleles, or the reference allele.

